Results
Introduction
This section presents the results of the household survey. First, the respondent sample is described along demographic lines (Section 4.2). Then, in Section 4.3, perceptions of area transport issues across the sample are summarised.
In Section 4.4, average relative speed estimates are compared across six demographic categories and statistically significant differences are noted.
About the Sample
Gender
The gender split of the survey respondents was relatively even, with 50% identifying as female and 49% as male. The remaining 1% either identify in another way or indicated they preferred not to provide this information.
Age
72% of the total respondents were between ages 55 and 84, with the relative majority in the 65-74 age range. There were only 17 respondents aged 25-34 and 1 aged 18-24.
Number of Years Living at Residence
Respondents skewed toward long or short tenancies in their residences. The highest percentage (28%) of respondents reported that they had lived in their home for less than five years; 22% reported living there for over 25 years.
Household description
Almost half (48%) of all respondents reported being retired, with 20% living in an immediate family group.
Disability
When asked if they consider themselves to have any disability or other long-term health problems that may limit their mobility in any way, the majority of respondents (72%) responded that they did not. The remaining 28% considered themselves to have some sort of disability or long-term illness impacting their mobility.
Vehicle Ownership
Participants were asked about the number of vehicles in their households. 89% of the respondents owned at least one vehicle, with 34% of them having two or more vehicles. 11% of respondents had no vehicle in the household.
Frequency of Contact with Neighbours
The majority of respondents reported (78%) meeting or seeing their neighbour(s) at least once a week.
Pet Ownership
63% of the respondents did not have any pets, while the remaining 37% owned at least one pet.
Perceptions of Area Transport Issues
Speed Estimate
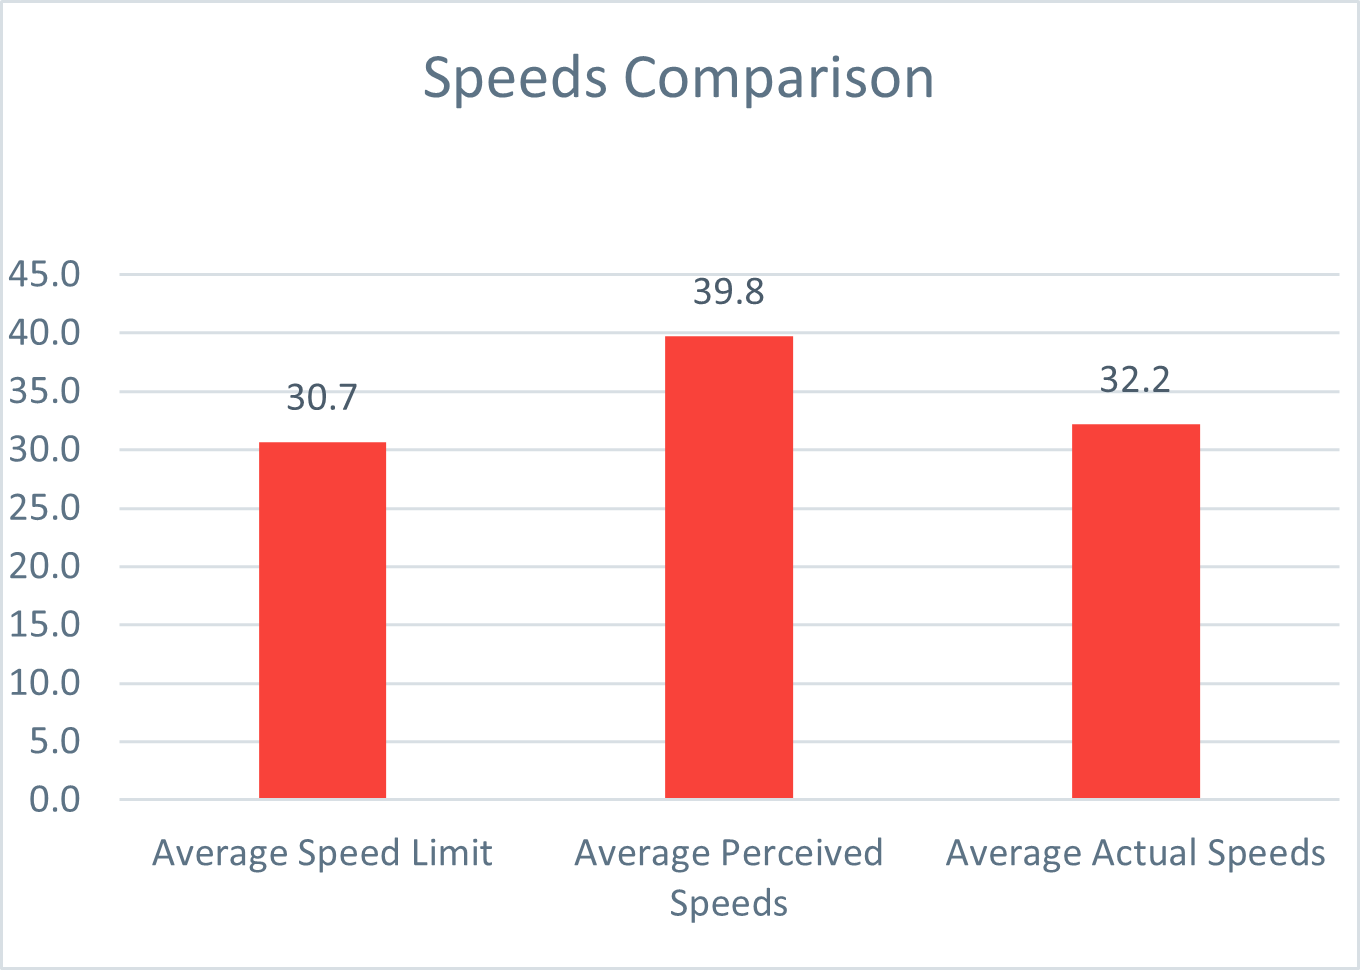
Participants were asked to estimate what speed they thought most traffic was travelling through their local area. This perceived speed was compared to the actual 85th percentile speed (captured over a 4-day period within two weeks of the study), and the speed limit for the section, as shown in Figure 4-1.
As illustrated in Figure 4-1, residents’ perceived traffic speed (39.8 mph) was higher than the actual 85th percentile speed (32.2 mph); both are higher than the average posted speed limit across all road sections (30.7 mph). This suggests that traffic is travelling through these settlements at speeds above the speed limit, but not to the extent that residents are perceiving.
Time of Issue Estimate
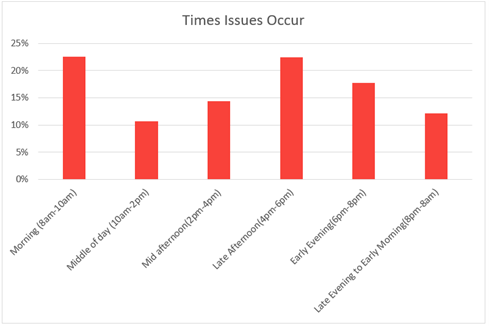
Respondents were also asked to indicate what time issues most frequently occurred or were most severe on their local trunk road. As shown in Figure 4-2 below, traffic issues were considered most problematic and morning and late afternoon peaks, but with continuing difficulties throughout the day.
Waiting Times Estimate
To identify a proxy measure for pedestrian suitability, respondents were asked to estimate how long it took to cross the road within their local area. As illustrated in Figure 4-3, the majority of respondents reported waiting at least a minute to cross the road, with a significant number of people reporting waiting over three minutes.
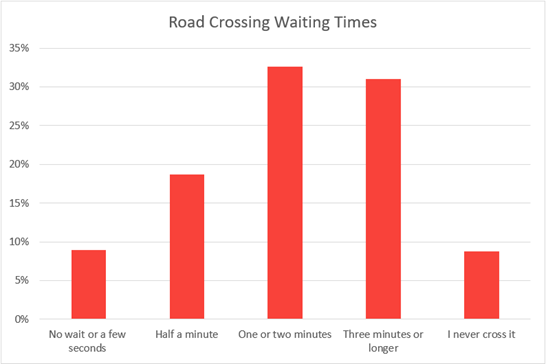
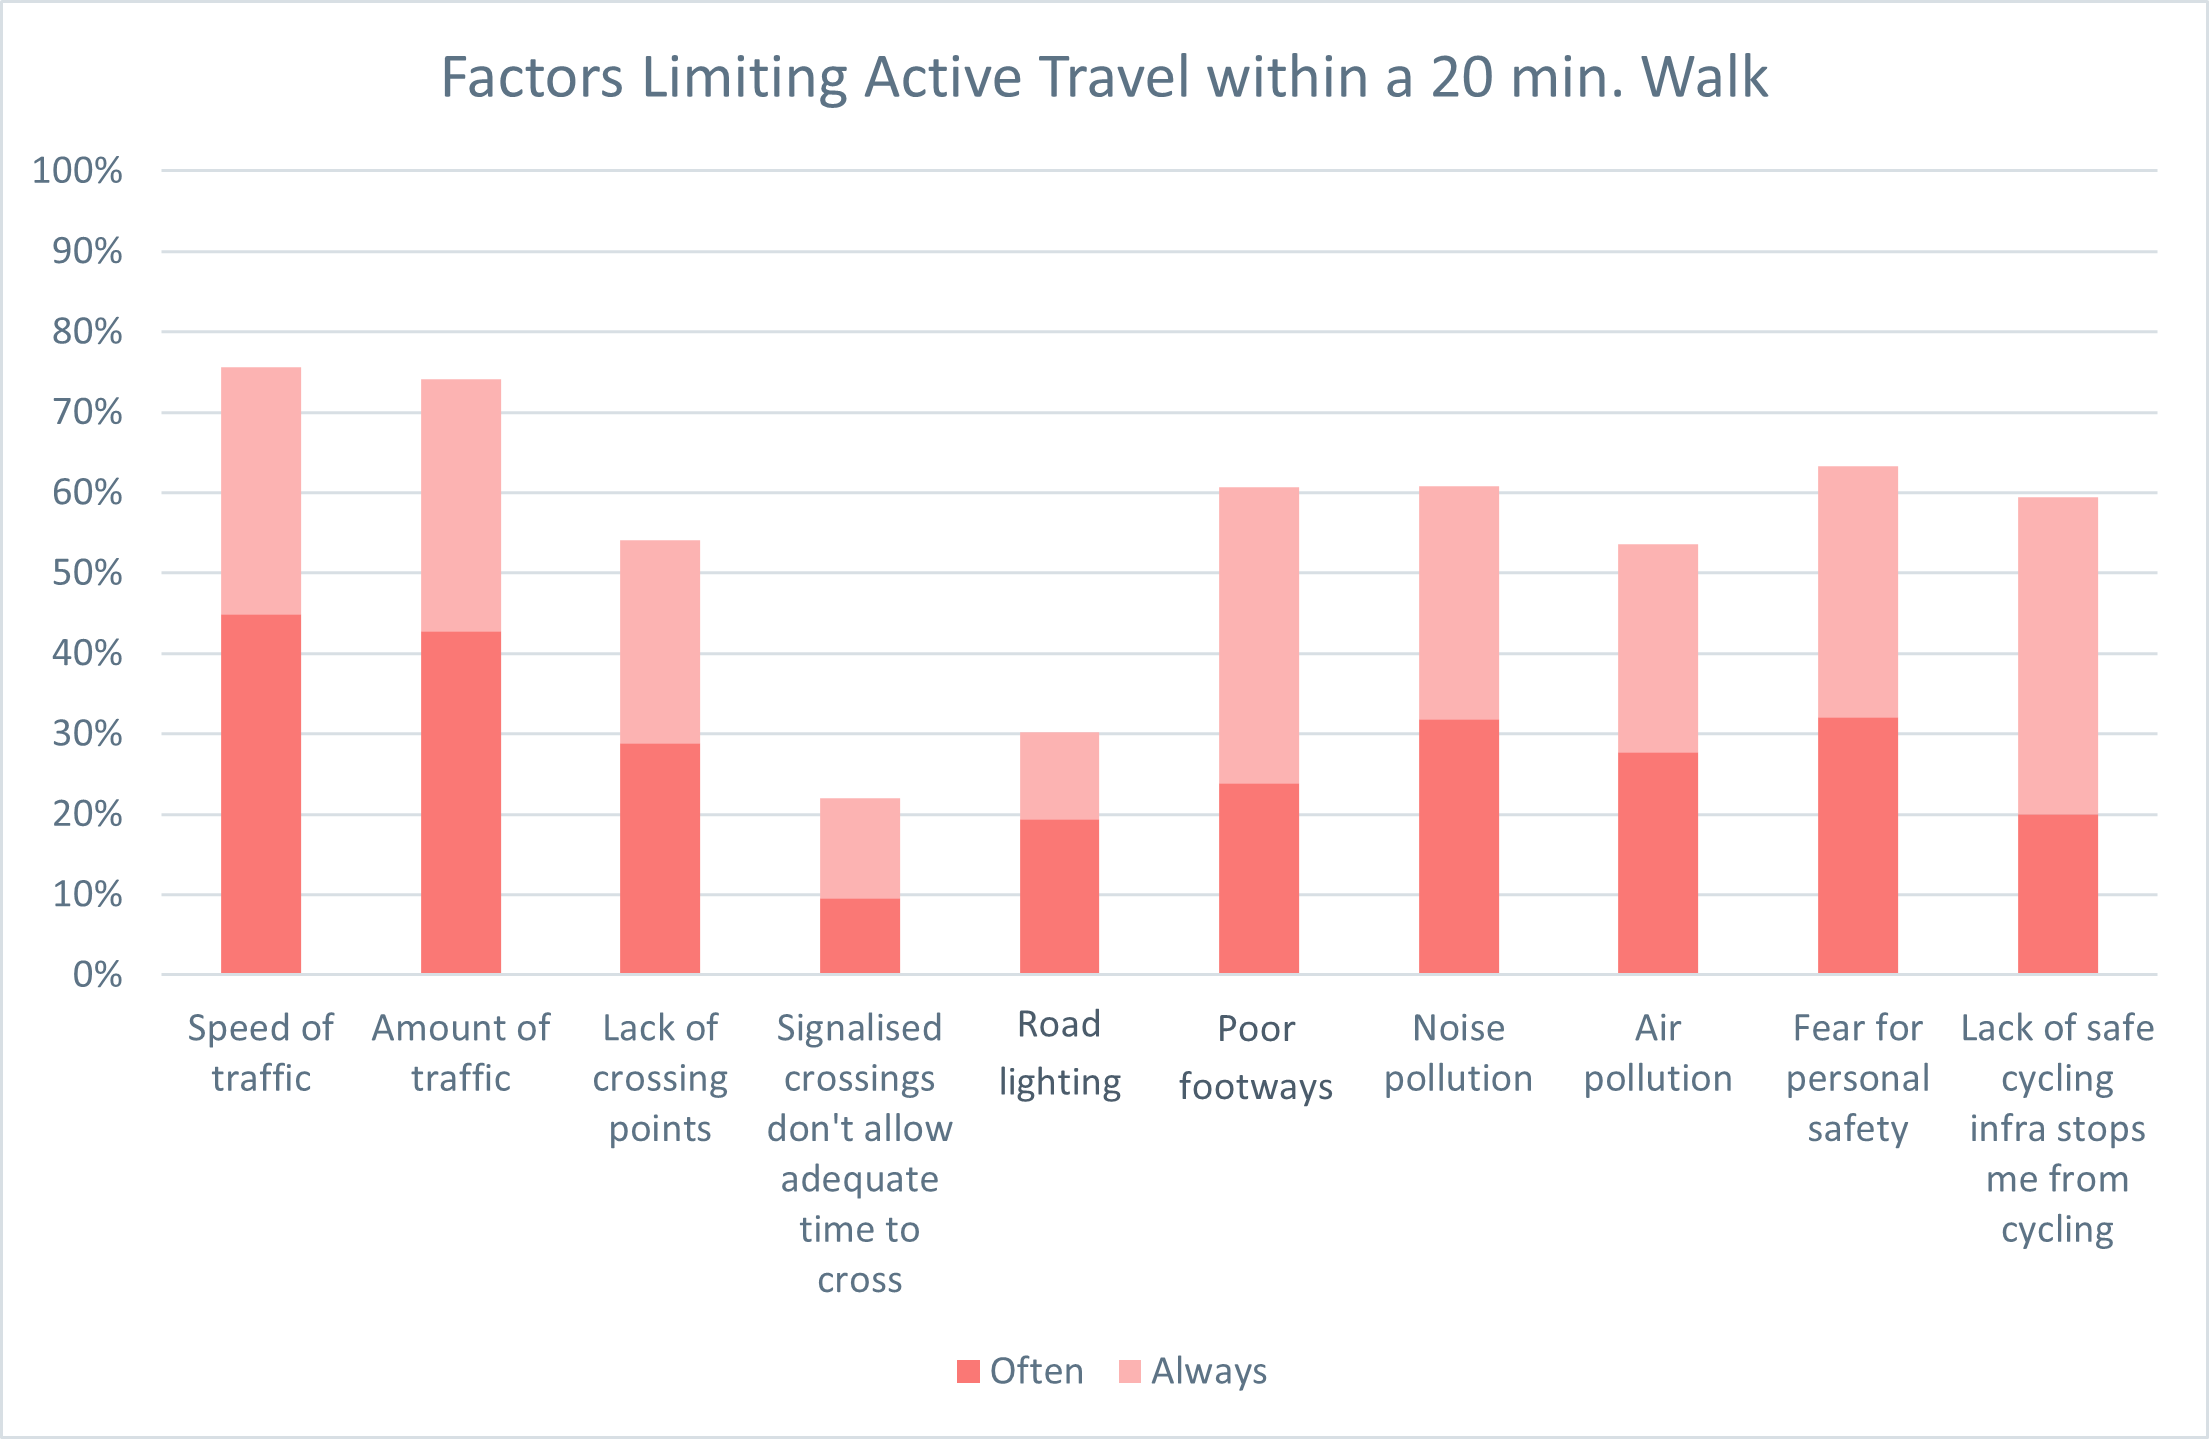
Figure 4-4 below illustrates the number of respondents who stated that each factor ‘Often’ or ‘Always’ impacted their ability to walk or cycle within the study area. With the exception of lighting and signalised crossing times, each factor was scored as ‘Often’ or ‘Always’ impacting active travel. Speed of traffic (89%), volume of traffic (87%) and noise pollution (78%) were cited most commonly as impacting factors.
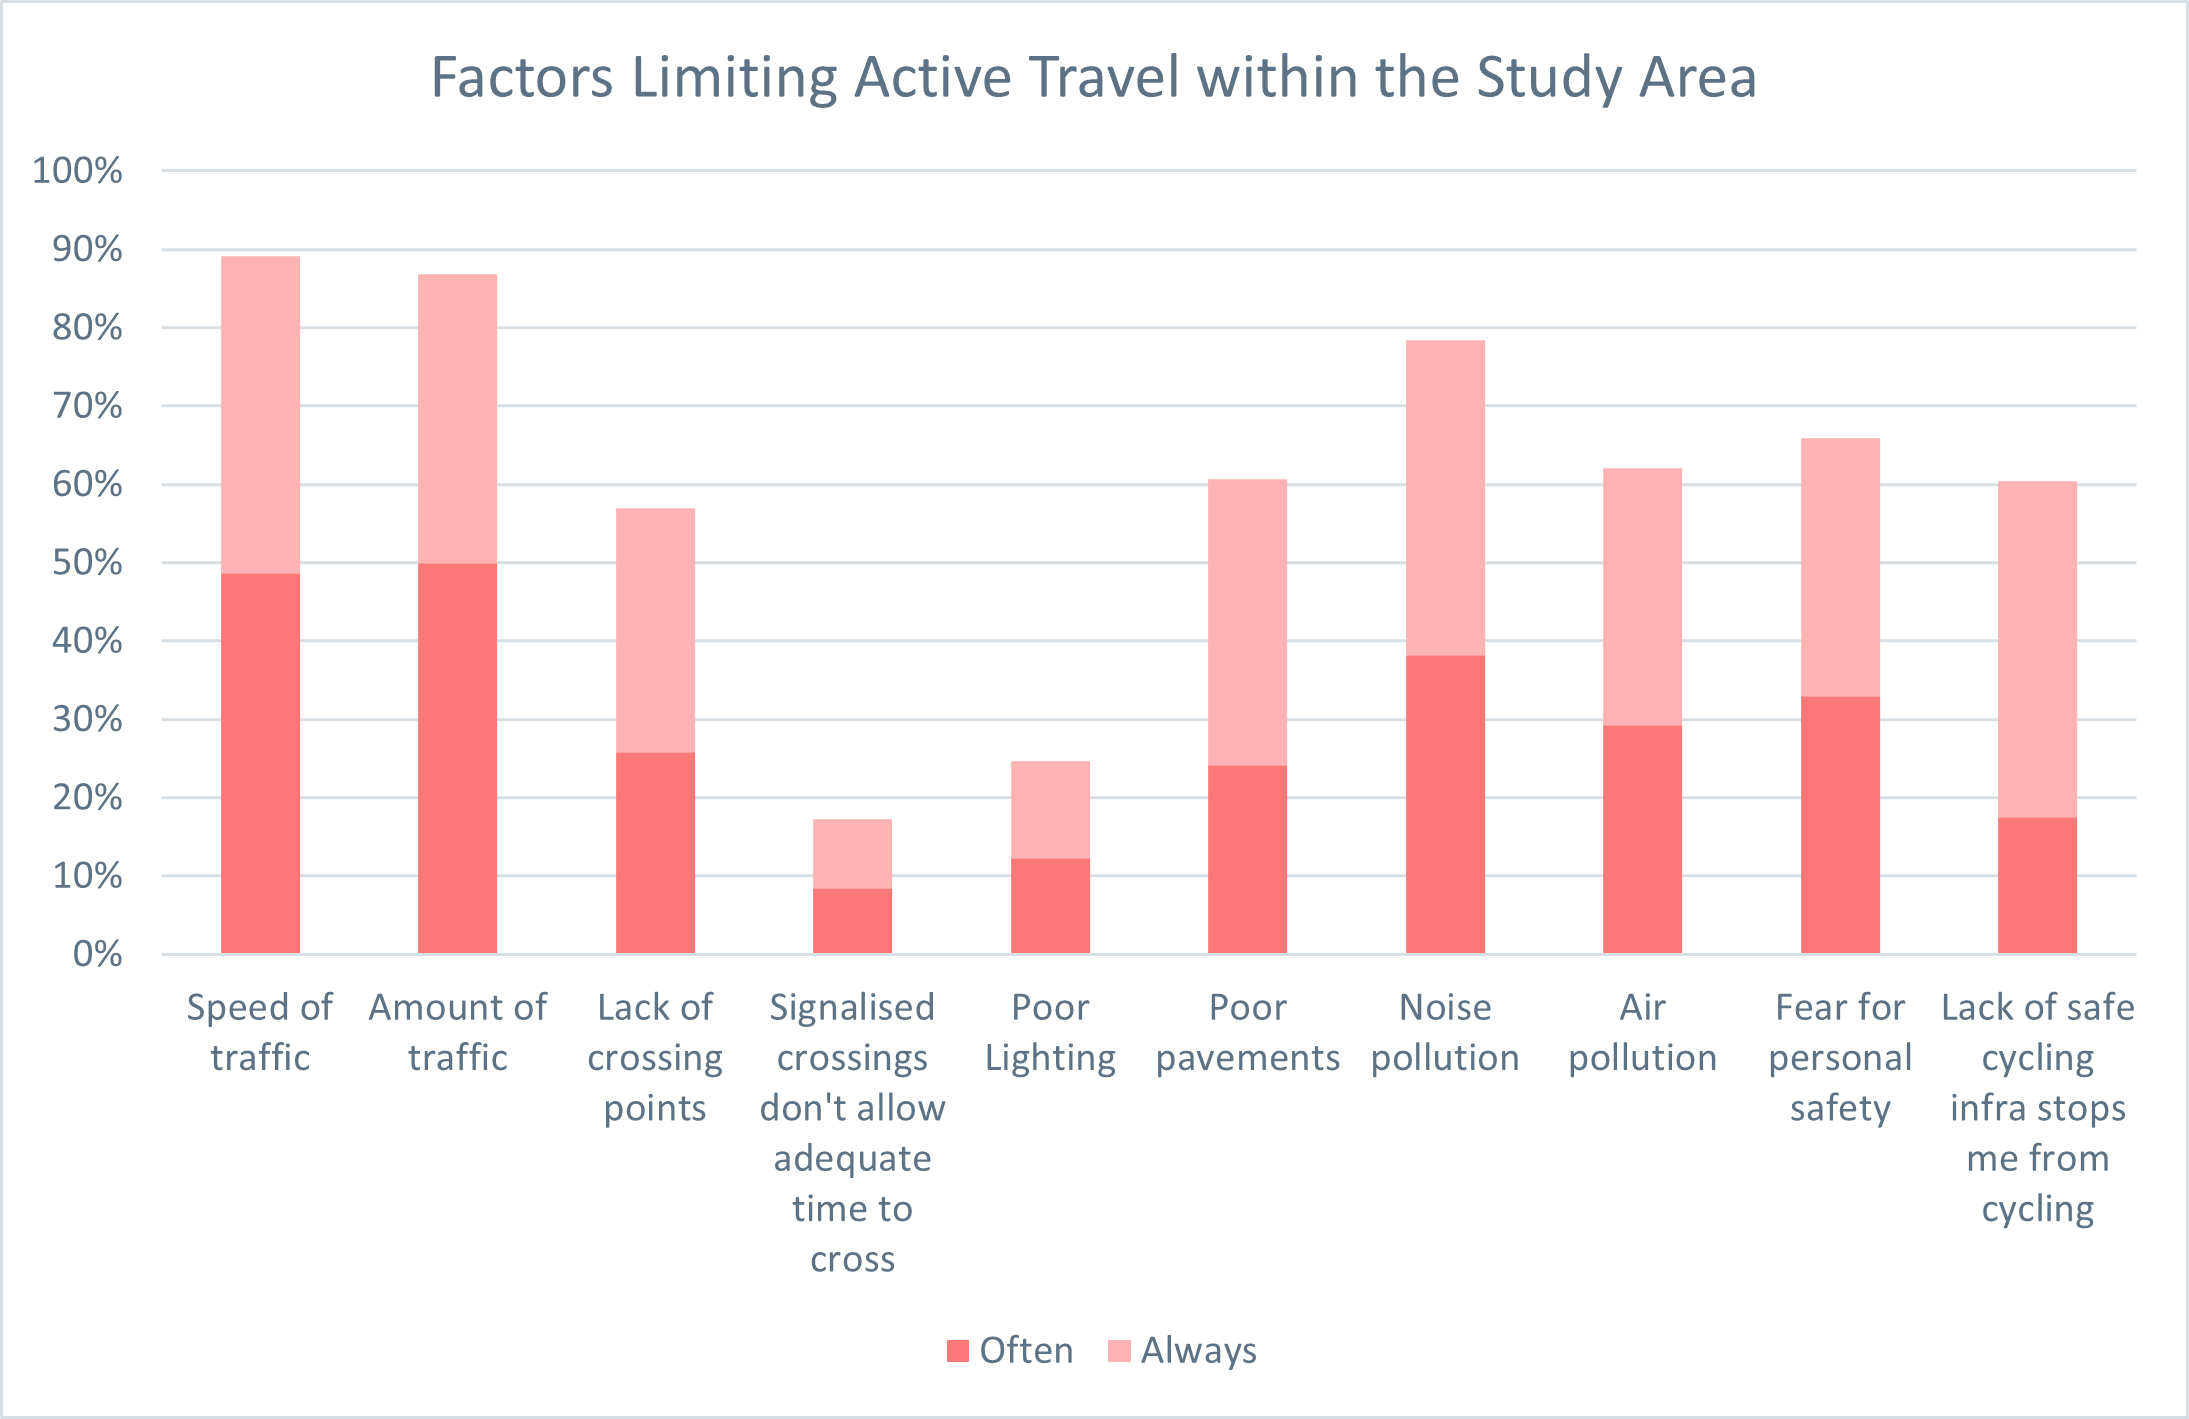
The responses regarding the wider area, shown in Figure 4-5, followed a similar trend, with all factors, with the exception of lighting and crossing times at signalised crossing, also returning over 50% for ‘Often’ or ‘Always’ impacting active travel. However, for each of the factors the percentage of responses returning as ‘Often’ or ‘Always’ was slightly lower than for the trunk road, suggesting whilst still a problem the problem is more prominent on the trunk road itself than within the wider area.
Demographic Analysis
Two sample t-tests were performed to compare the relative speed estimate across five demographic groups. The results of these tests are summarised in brief below.
To facilitate interpretation of statistical results, a brief explanation of all abbreviated variables is located in table 4-1 below.
| Abbreviation | Term | Notes |
|---|---|---|
| M | Arithmetic mean (average) | None |
| SD | Standard deviation | Measures variability within the sample |
| t | Indicates a 't-test, comparing two averages across different groups | The t-test is customarily followed by the degrees of freedom in brackets. |
| p | Probability of outcome occurring by chance | For this study, we have considered an outcome 'statistically significant' if there is less than a 10% chance of it occurring by chance (p < 0.1) |
| R2 | A goodness-of-fit measure for linear regression models. | This statistic indicates the percentage of the variance in the dependent variable that the independent variables explain collectively. |
| F | Fit of independent variables to data. | In essence, this statistic tests if the regression model as a whole is useful. |
| β | Coefficient describing a linear/exponential relationship between the variables | In a linear regression, this is the slope of a line. |
| S.E. | Standard error | Standard deviation of the estimated population distribution |
| T statistic | Coefficient divided by its standard error. | None |
| 95% CI | 95% confidence interval | It is 95% likely that the actual coefficient falls between the two listed numbers. |
Gender
There was not a significant difference in relative speed estimate between male respondents (M = 7.29, SD = 6.60) and female respondents (M = 7.66, SD = 6.85); t(534) = 0.63, p = 0.528.
Disability
The 149 respondents who said they had a disability which limited their day to day movement (M = 8.52, SD = 6.44), compared to respondents who said they did not have a disability (M = 7.06, SD = 6.76), recorded significantly higher relative speed estimates, t(279) = 2.31, p = 0.021.
Vehicle in Household
There was not a significant difference in relative speed estimate between respondents with one or more vehicles in the household (M = 7.49, SD = 6.59) and respondents with no vehicles in the household (M = 7.07, SD = 7.50); t(78) = 0.43, p = 0.334.
Children in Household
There was not a significant difference in relative speed estimate between respondents with children in the household (M = 7.96, SD = 7.43) and respondents with no children in the household (M = 7.36, SD = 6.58); t(93) = 0.66, p = 0.514.
Dog or Cat in Household
The 197 respondents with a cat and/or dog in the household (M = 8.23, SD = 6.99), compared to respondents who with no cat/dog (M = 6.96, SD = 6.45) recorded significantly higher relative speed estimates, t(381) = 2.09, p = 0.037.
Age
A linear regression model found no statistically significant relationship between age and relative speed estimate (p = 0.683)
Multiple Linear Regression Model
Multiple linear regression was used to test if the research variables in Table 4-2 below significantly predicted the relative speed estimate.
The reduced, fitted regression model was:
Relative Speed Estimate = 5.63 + 0.59*(Disability Asgt.) + 1.02 (Pets Asgt.) – 1.56*(Volume of Traffic in 10k’s).
The overall regression was statistically significant (R2 = 0.02, F(3, 551) = 4.68, p = 0.003).
In the fitted model, the three variables were found to significantly predict Relative Speed Estimates:
- Disability Category Assignment (β = 1.39, p = 0.018);
- Pets Category Assignment (β = 1.020, p = 0.064); and
- Volume of Traffic (10k’s) (β = -1.560, p = 0.015)
The full results of the linear regression model and all included independent variables, before model fitting, are detailed in Table 4-2 below.
| Independent Variables | Coefficient (β) | Standard Error | T-statistic | Significance (p-value) |
|---|---|---|---|---|
| Disability Assignment | 1.566 | 0.640 | 2.449 | 0.015** |
| Volume of Traffic (10k's) | 0.000 | 0.000 | -2.142 | 0.033** |
| 85th Percentile Speed | -0.199 | 0.117 | -1.699 | 0.090* |
| Pets (Assignment) | 1.005 | 0.613 | 1.639 | 0.102 |
| Width of Road | -0.546 | 0.339 | -1.608 | 0.108 |
| School near the section | 0.864 | 0.780 | 1.107 | 0.269 |
| Years lived at current address | 0.021 | 0.022 | 0.956 | 0.339 |
| Presence of bus stop(s) | 0.749 | 0.859 | 0.872 | 0.383 |
| Footway width | -0.231 | 0.310 | -0.744 | 0.457 |
| Land Use | 0.630 | 0.982 | 0.641 | 0.522 |
| Frequency of meeting with neighbours | -0.176 | 0.288 | -0.610 | 0.542 |
| Children in Household | 0.556 | 0.955 | 0.583 | 0.560 |
| Age | -0.011 | 0.023 | -0.461 | 0.645 |
| Gender | 0.165 | 0.527 | 0.313 | 0.754 |
| Vehicles in household | 0.145 | 0.492 | 0.294 | 0.769 |
| Pedestrian crossing in road section | -0.073 | 0.404 | -0.181 | 0.856 |
| Footway presence | -0.111 | 1.015 | -0.110 | 0.913 |
(Note: In all tables in this and the following section, levels of significance below the following alpha values are denoted as follows: p < .10*, p < .05**, p < .01***)
Logistic Regression Model
Multiple logistic regression was used to analyse the relationship between the research variables and the relative speed estimate being above either the 5mph or 10mph threshold (5+mph / 10+mph).
5mph Threshold
As summarised in Table 4-3 below, it was found that, holding all other factors constant, the likelihood of the Relative Speed Estimate being 5+mph increased by:
- 208% (95% CI [1.50, 6.35]) for people with children in the household;
- 57% (95% CI [0.93, 2.65]) for each increase in the ‘commercial’ index utilised.
- 36% (95% CI [1.01, 1.83]) for each vehicle in the household (up to 2);
- 1% (95% CI [1.00, 1.03]) for each additional year of living in the residence; and
The odds decreased by 84% (95% CI [0.71, 1.00]) for each additional meter of road width beyond the sample’s mean road width.
| Independent Variables | Coefficient (β) | Standard Error | Significance (p-value) | Odd Ratio |
|---|---|---|---|---|
| Children in Household | 1.126 | 0.369 | 0.002*** | 3.082 |
| Vehicles | 0.307 | 0.153 | 0.045** | 1.359 |
| Width of Road | -0.174 | 0.088 | 0.049** | 0.840 |
| Time lived at current address | 0.012 | 0.007 | 0.080* | 1.012 |
| Land Use | 0.449 | 0.268 | 0.093* | 1.567 |
The full results of the logistic regression between a 5+mph Relative Speed Estimate and all included independent variables, prior to model fitting, are detailed in Table 4-4 below.
| Independent Variables | Coefficient (β) | Standard Error | Significance (p-value) | Odd Ratio |
|---|---|---|---|---|
| Children in Household | 1.023 | 0.396 | 0.010** | 2.782 |
| Time lived at current address | 0.015 | 0.008 | 0.047** | 1.015 |
| Disability | 0.402 | 0.220 | 0.068* | 1.495 |
| Vehicles in household | 0.304 | 0.168 | 0.071* | 1.355 |
| Pedestrian crossing in road section | -0.237 | 0.140 | 0.091* | 0.789 |
| Land Use | 0.514 | 0.329 | 0.118 | 1.672 |
| Width of Road | -0.175 | 0.116 | 0.132 | 0.840 |
| Age | -0.010 | 0.008 | 0.194 | 0.990 |
| Barrier between footway and traffic | 0.447 | 0.347 | 0.198 | 1.564 |
| School near the section | 0.359 | 0.296 | 0.225 | 1.432 |
| Footway presence | 0.362 | 0.349 | 0.300 | 1.436 |
| Presence of bus stop(s) | -0.292 | 0.305 | 0.338 | 0.747 |
| Footway width | -0.053 | 0.112 | 0.639 | 0.949 |
| Gender | -0.054 | 0.181 | 0.768 | 0.948 |
| Volume of Traffic (10k's) | -0.084 | 0.287 | 0.769 | 0.919 |
| Pets | 0.049 | 0.212 | 0.819 | 1.050 |
10mph Threshold
As summarised in Table 4-5 below, it was found that, holding all other factors constant, the odds of the Relative Speed Estimate being 10+mph increased by:
- 114% (95% CI [1.37, 3.32]) for road sections with a barrier between the footway and traffic;
- 101% (95% CI [1.05, 4.19]) for each increase in the ‘commercial’ index utilised.
- 86% (95% CI [1.27, 2.72]) for each additional year of living in the residence; and
- 72% (95% CI [1.02, 2.93]) for people with children in the household;
- 68% (95% CI [1.17, 2.42]) for people with a cat and/or dog in the household;
The odds of the Relative Speed Estimate being more than 10+mph decreased by
- 89% (95% CI [0.82, 0.95]) for each additional mph; and
- 77% (95% CI [0.62, 0.95]) for each additional meter of road width;
- 64% (95% CI [0.39, 1.05]) for each additional 10,000 vehicles using the road per day
| Independent Variables | Coefficient (β) | Standard Error | Significance (p-value) | Odd Ratio |
|---|---|---|---|---|
| Barrier between footway and traffic | 0.758 | 0.225 | 0.001*** | 2.135 |
| 85th Percentile Speed | -0.121 | 0.037 | 0.001*** | 0.886 |
| Disability Assignment | 0.619 | 0.196 | 0.002*** | 1.857 |
| Pets | 0.520 | 0.186 | 0.005*** | 1.683 |
| Width of Road | -0.264 | 0.107 | 0.014** | 0.768 |
| Land Use | 0.743 | 0.352 | 0.035** | 2.102 |
| Children in Household | 0.546 | 0.270 | 0.043** | 1.726 |
| Volume of Traffic (10k's) | -0.444 | 0.252 | 0.078* | 0.641 |
The full results of the logistic regression between a 10+mph Relative Speed Estimate and all included independent variables are detailed in Table 4-6 below.
| Independent Variables | Coefficient (β) | Standard Error | Significance (p-value) | Odd Ratio |
|---|---|---|---|---|
| Pets | 0.596 | 0.204 | 0.003*** | 1.814 |
| Disability | 0.589 | 0.212 | 0.005*** | 1.802 |
| Width of Road | -0.273 | 0.113 | 0.016** | 0.761 |
| 85th Percentile Speed | -0.102 | 0.045 | 0.023** | 0.903 |
| Children in Household | 0.613 | 0.311 | 0.049** | 1.846 |
| Barrier between footway and traffic | 0.543 | 0.324 | 0.094* | 1.722 |
| Footway | 0.567 | 0.346 | 0.101 | 1.763 |
| Volume of Traffic (10k's) | -0.441 | 0.279 | 0.114 | 0.643 |
| Land Use | 0.540 | 0.378 | 0.153 | 1.716 |
| Gender Assignment | 0.180 | 0.176 | 0.306 | 1.197 |
| Footway width | -0.102 | 0.102 | 0.317 | 0.903 |
| Frequency of meeting with neighbours | -0.093 | 0.097 | 0.336 | 0.911 |
| Vehicle in household | -0.158 | 0.166 | 0.340 | 0.854 |
| School near the section | 0.212 | 0.280 | 0.449 | 1.236 |
| Pedestrian crossing in road section | 0.075 | 0.132 | 0.570 | 1.078 |