Desktop Review
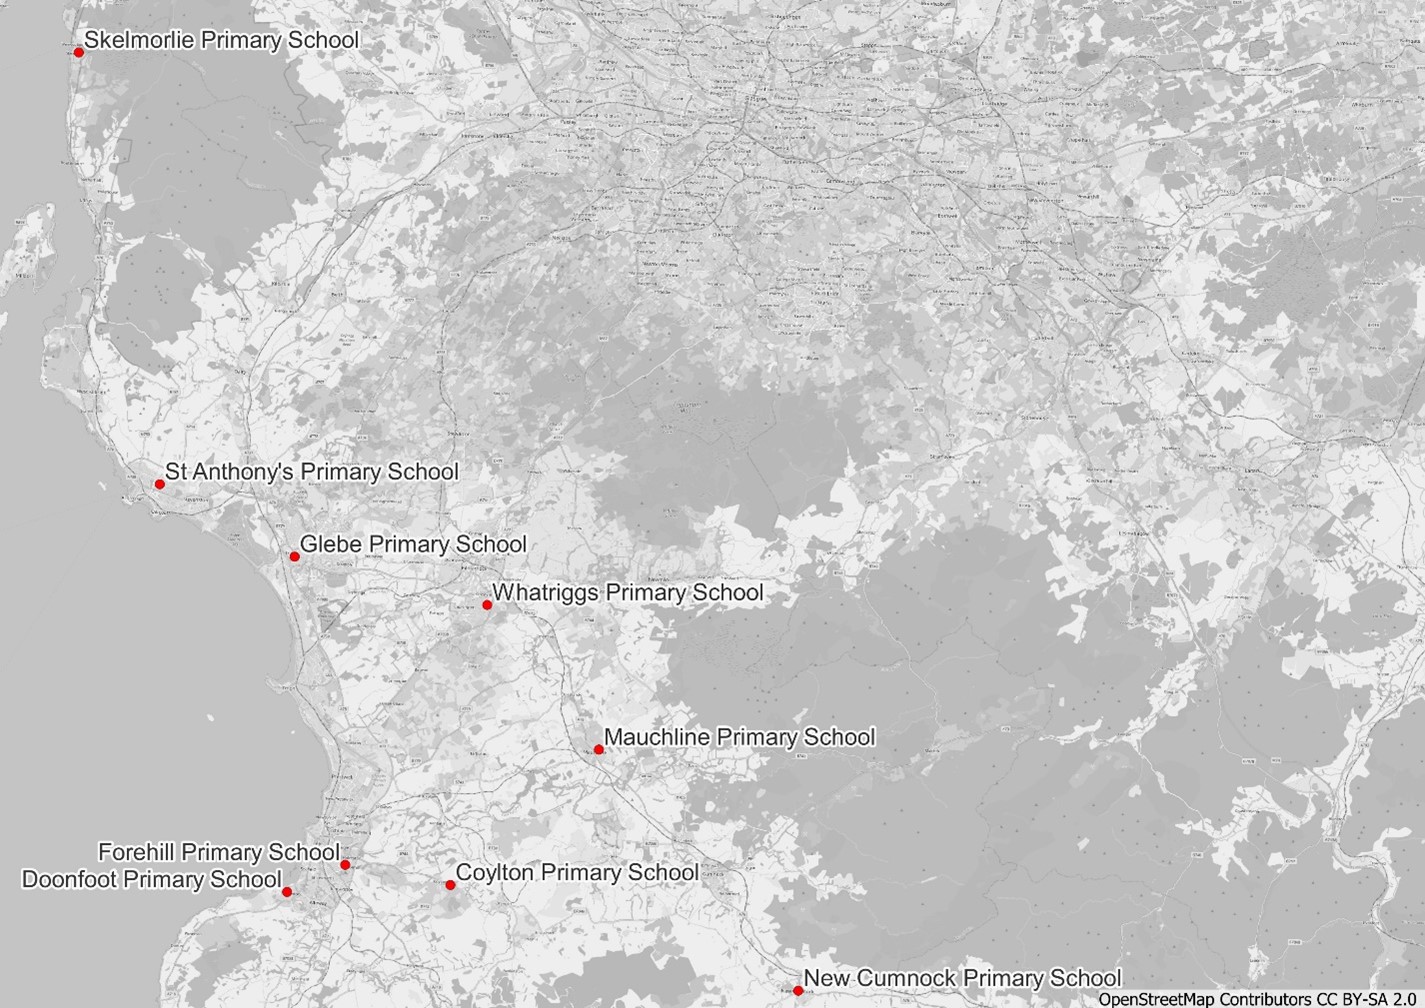
This section presents contextual information for each of the nine schools participating in the trial. Figure 2 shows the locations of the schools, and Table 1 summarises key context including school roll, location, travel to school data from the Sustrans’ Hands Up Survey (HUS), Scottish Index of Multiple Deprivation (SIMD) data, and car/van availability in the local area.
Additional detail is included in Appendix A, including general context, participation in other active travel and road safety schemes, catchment, accident data, and air quality data where available.
| School | LA | Location | School Roll | HUS % Driven | SIMD % Quintile 1 | Households % with No Car/Van |
|---|---|---|---|---|---|---|
| St. Anthony's | NAC | Saltcoats | 240 | 35% | 42% | 32% |
| Skelmorlie | NAC | Skelmorlie | 125 | 28% | 0% | 13% |
| Glebe | NAC | Irvine | 350 | 46% | 58% | 38% |
| Whatriggs | EAC | Kilmarnock | 518 | 17% | 43% | 37% |
| Mauchline | EAC | Mauchline | 272 | 20% | 18% | 22% |
| New Cumnock | EAC | New Cumnock | 229 | 20% | 40% | 32% |
| Coylton | SAC | Coylton | 265 | 24% | 0% | 11% |
| Doonfoot | SAC | Ayr | 229 | 32% | 0% | 8% |
| Forehill | SAC | Ayr | 454 | 32% | 0% | 22% |
This table is based on the latest data available at the time of publication. The ‘SIMD % Quintile 1’ shows the proportion of catchment population within the 20% most deprived datazones based on the Scottish Index of Multiple Deprivation.