Appendix A: School Context
North Ayrshire
St. Anthony’s Primary School, Saltcoats
Context
School Role: 240 pupils
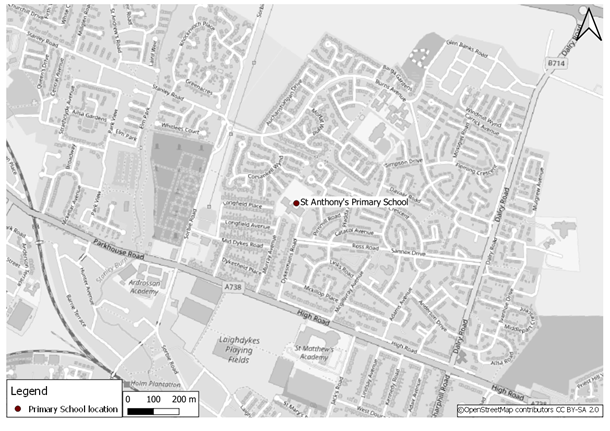
St Anthony’s Primary School is located in a residential area in the northern part of Saltcoats and is at the dead end of Dykesmains Road which connects to the A738 High Road. The school is within a mile of the nearby Dykesmains Primary School and two Secondary Schools and can be accessed by bus from stops on the adjacent Dykesmains Road and Kilbrannan Avenue. There is a staff car park and a separate large car park which visitors can use along with a 3 cycle rack with up to 30 spaces for bicycles. The surrounding network contains pavements and multiple pedestrian crossings.
The school previously facilitated a park and stride system to help address problems with parental parking creating congestion at peak times. This operated on the nearby A738 High Road where parents/carers were encouraged to park and walk the remaining short distance to the school. Furthermore, the school is currently running a walking bus one day a week and have previously participated in the Walk to School Week which has developed in to Travel Smart Week taking place in May.
St Anthony’s participate in the iCycle (iCycle Website) programme, aimed at assisting teachers and trainers with supporting safe cycling for young people and JRSO (JRSO Website) programme to help promote road safety issues within the school and local community.
Table A- 1 presents Travel to School Mode Share data from the Sustrans Hands Up Survey (Sustrans Hands Up Survey Website) and suggests that the proportion of children driven to school decreased from 45.1% in 2017 to 33.7% in 2018, then remained between 35.8% and 35.3% between 2019 and 2021, with a slight drop to 31.4% in 2020.Walking levels increased between 2017 and 2018, but then fell consistently from 2019 onwards.
| Year | Walk | Cycle | Scooter/Skate | Park and Stride | Driven | Bus | Taxi | Other | Total |
|---|---|---|---|---|---|---|---|---|---|
| 2017 | 38.3% | 4% | * | 12% | 45.1% | 0% | 0% | * | 175 |
| 2018 | 41.4% | 4.7% | 3% | 11.8% | 33.7% | 3.6% | * | * | 169 |
| 2019 | 37.6% | 4.1% | * | 19.7% | 35.8% | * | * | 0% | 218 |
| 2020 | 34.8% | 5.8% | 3.3% | 15.7% | 31.4% | 8.3% | * | * | 242 |
| 2021 | 32.8% | * | 4.6% | 14.7% | 35.3% | 6.3% | 3.4% | * | 238 |
Where a percentage represents a value of between one and four pupils, it has been suppressed to maintain anonymity of respondents. In this case, values have been replaced with an asterisk (*).
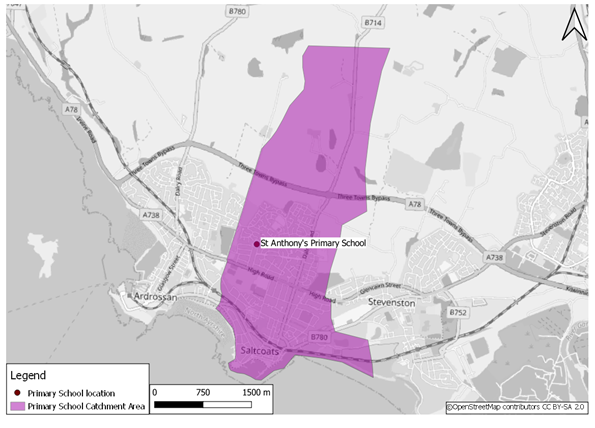
Catchment Area
Accident Data
There was a total of 2 accidents within 400m of the school between 2017 and 2021 (Department for Transport – Road Safety Data).
SIMD
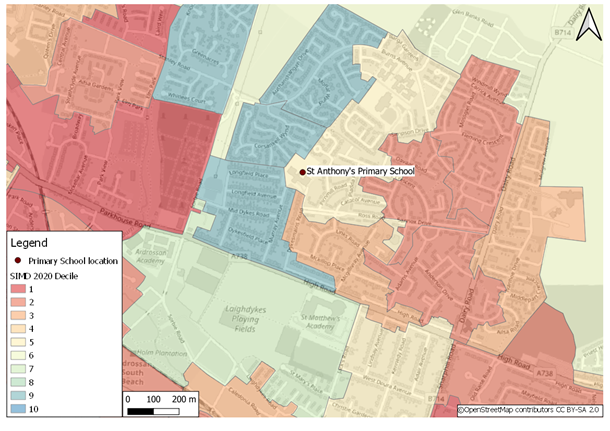
The above map suggests varying levels of deprivation, with 1 being the most deprived and 10 being the least deprived, in the area around St. Anthony’s Primary with areas of low deprivation immediately west of the school and areas of high deprivation to the east and further west (SIMD Website).
Car or Van Availability
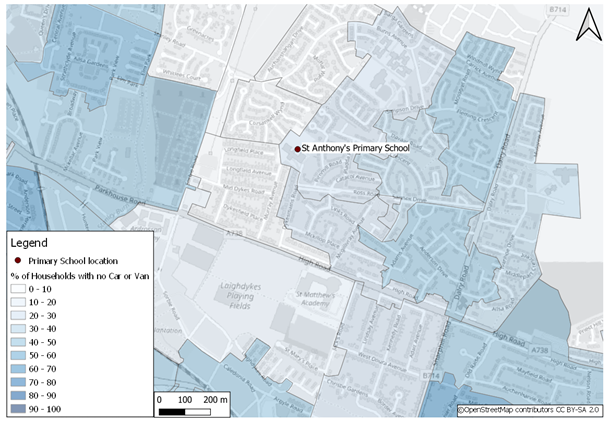
The map shows that most households in the area surrounding the school had one or more cars or vans available in 2011 (Scotland Census 2011). Households to the west and parts of the east recorded the highest proportions of households without access to a vehicle, between 70 and 80% in some datazones.
Air Quality
There are no air quality monitoring sites within 400m of the school.
Skelmorlie Primary School, Skelmorlie
Context
School Role: 125 pupils
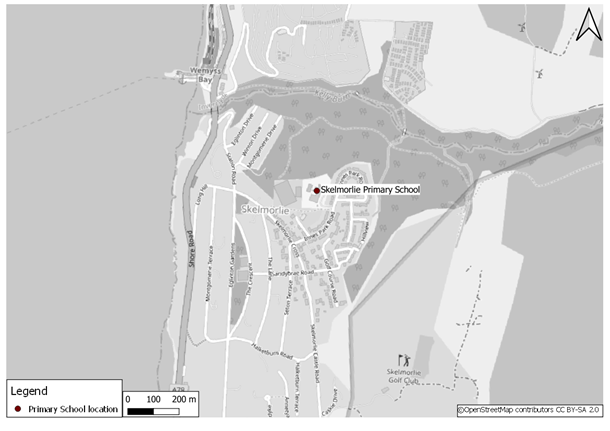
Skelmorlie Primary School is the only school in the village of Skelmorlie and is located between an expansive woodland area to the west and north and a residential area to the east. The school can be accessed by bus services which serve Innes Park Road and is near the Skelmorlie Community Centre. There are wide pavements and pedestrian crossings on the surrounding road network. There is limited onsite parking and some street parking on Innes Park Road while there is a 20 space cycle rack located on the school site.
The school previously operated a park and stride system, which aimed to alleviate problems associated with parental parking. This was at the nearby Community Centre where parents/carers were encouraged to park and walk the remaining short distance to the school. Furthermore, the school has previously participated in the Walk to School Week which has developed in to Travel Smart Week taking place in May.
Skelmorlie Primary School participates in the iCycle (iCycle Website) programme, aimed at assisting teachers and trainers with supporting safe cycling for young people and the JRSO (JRSO Website) programme to help promote road safety issues within the school and local community.
The travel to school mode share in Table A-2 shows a majority of pupils travelling actively to school, although this reduced from roughly 75% in 2017 to around 65% each year from 2018 to 2020 (Sustrans Hands Up Survey Website).
| Year | Walk | Cycle | Scooter/Skate | Park and Stride | Driven | Bus | Taxi | Other | Total |
|---|---|---|---|---|---|---|---|---|---|
| 2017 | 62.8% | 12.8% | * | * | 19.8% | 0% | 0% | 0% | 86 |
| 2018 | 59.5% | 6% | * | * | 25% | 0% | 0% | * | 84 |
| 2019 | 47% | 19.7% | * | 9.1% | 18.2% | 0% | 0% | * | 66 |
| 2020 | 64.9% | * | * | 0% | 28.4% | 0% | 0% | 0% | 74 |
| 2021 | No data | No data | No data | No data | No data | No data | No data | No data | No data |
Where a percentage represents a value of between one and four pupils, it has been suppressed to maintain anonymity of respondents. In this case, values have been replaced with an asterisk (*).
Catchment Area
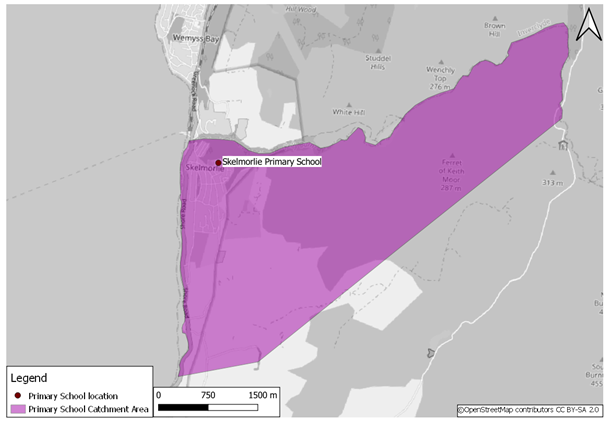
The catchment area for Skelmorlie Primary School covers the village of Skelmorlie and extends into rural areas in the north east (Scottish Government Primary School Catchments – North Ayrshire).
Accident Data
There were no road accidents within 400m of the school between 2017 and 2021 (Department for Transport – Road Safety Data).
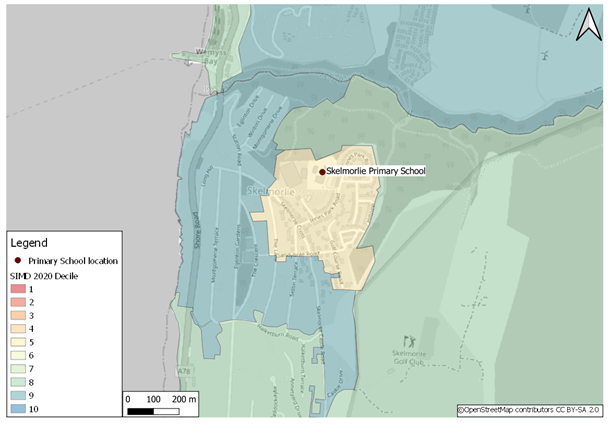
SIMD
Car or Van Availability
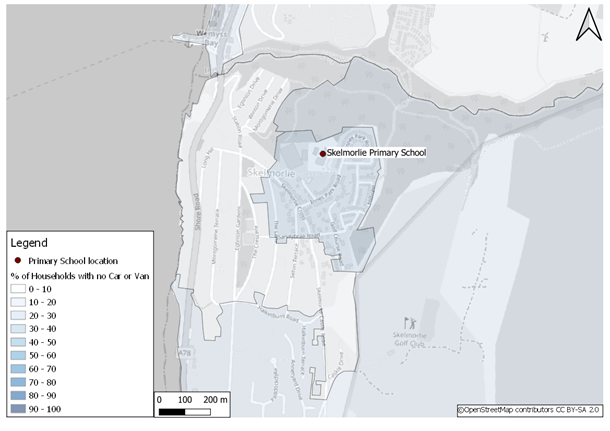
Car or van availability is high in the area surrounding Skelmorlie Primary School. The proportion of households with no car or van is between 0 and 30% for all datazones in the area (Scotland Census 2011).
Air Quality
There are no air quality monitoring sites within 400m of the school.
Glebe Primary School, Irvine
Context
School Role: 350 pupils
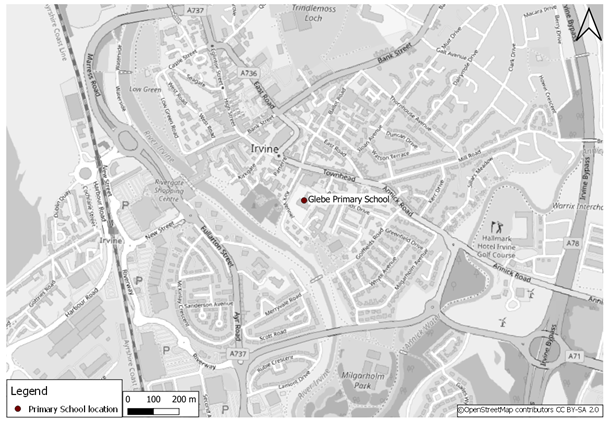
Glebe Primary School is close to the centre of Irvine and adjacent to Kirk Vennel and Bradbury Glebe in a residential environment. The school is within a mile of three other Primary Schools. Kirk Vennel connects to the B7081 which is served by multiple bus services. The school contains a turning circle to the front adjacent to Kirk Vennel, allowing pick-up and drop-off of pupils. There is staff and visitor parking within the main site, along with two 10 space cycle racks. There are wide pavements and pedestrian crossings on the surrounding road network.
The school previously operated a park and stride system to help address problems with parental parking creating congestion. This took place at the nearby Golffields Road where parents/carers were encouraged to park their car and walk the remaining short distance to the school. Furthermore, the school has previously participated in the Walk to School week which has developed in to Travel Smart week taking place in May.
As with St. Anthony’s and Skelmorlie Primary Schools, Glebe participates in the iCycle (iCycle Website) programme, aimed at assisting teachers and trainers with supporting safe cycling for young people and JRSO (JRSO Website) programme to help promote road safety issues within the school and local community.
Table A-3 below shows the travel to school mode share and indicates a greater proportion of pupils being driven to school compared to the other North Ayrshire schools while walking levels have decreased slightly from 30.9% to 25.9%. The proportion of children cycling has risen to and remained fairly stable between 3.8% and 5.5% while Bus and Park & Stride accounted for 16.1% of the mode share in 2021 (Sustrans Hands Up Survey Website).
| Year | Walk | Cycle | Scooter/Skate | Park and Stride | Driven | Bus | Taxi | Other | Total |
|---|---|---|---|---|---|---|---|---|---|
| 2017 | 30.9% | 3.8% | 2.3% | 13% | 44.2% | 4.3% | 1.4% | 0% | 346 |
| 2018 | 30.4% | 4% | * | 9.1% | 51.7% | 4.3% | * | 0% | 352 |
| 2019 | No data | No data | No data | No data | No data | No data | No data | No data | No data |
| 2020 | 28.8% | 5.5% | 1.7% | 0% | 58.2% | 5.8% | 0% | 0% | 292 |
| 2021 | 25.9% | 5.5% | * | 10.2% | 46.% | 5.9% | 3.1% | * | 255 |
Where a percentage represents a value of between one and four pupils, it has been suppressed to maintain anonymity of respondents. In this case, values have been replaced with an asterisk (*).
Catchment Area
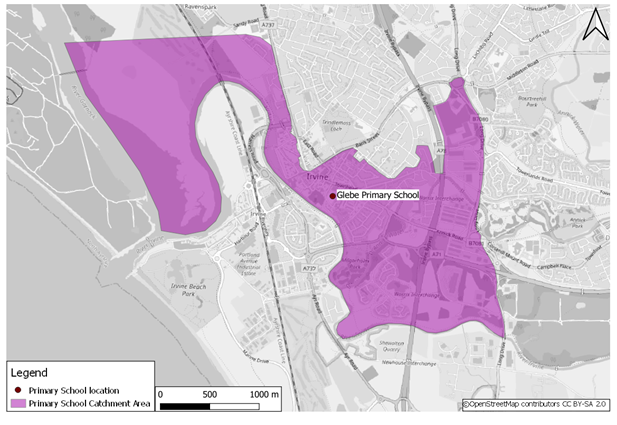
The catchment area covers the centre of Irvine, extending east into residential areas beyond the A77 and west beyond the Ayrshire Coast Railway Line (Scottish Government Primary School Catchments – North Ayrshire).
Accident Data
There was a total of 13 accidents within 400m of the school between 2017 and 2021 (Department for Transport – Road Safety Data).
SIMD
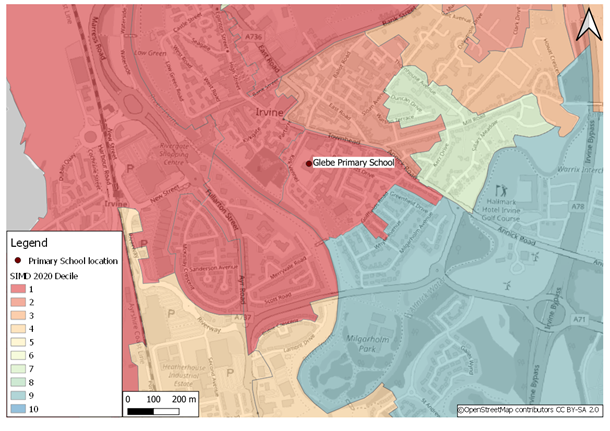
The primary school is in an area with fairly high levels of deprivation with the immediate area around and to the north west of the school in the most deprived decile. There are areas of lower deprivation to the south east (SIMD Website).
Car or Van Availability
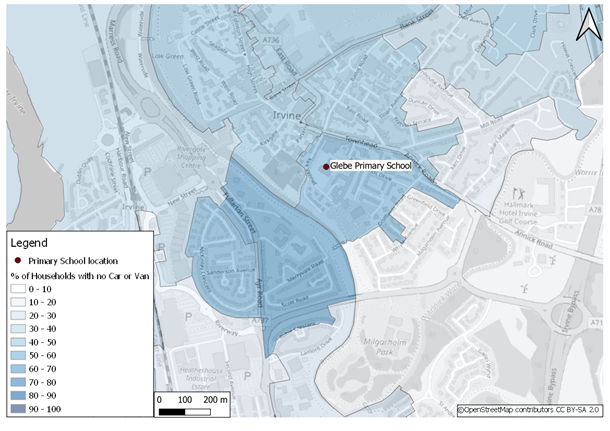
Car or van availability in the area is mixed with the immediate area around the school and to the north and west recording levels of 60 to 100% of households with no vehicle available. There is a link with the SIMD levels with the most deprived areas, as shown in Figure A- 12, recording the highest levels of no car or van availability while in the south east only 0 to 10% households were without a vehicle which is where deprivation was lowest (Scotland Census 2011).
Air Quality
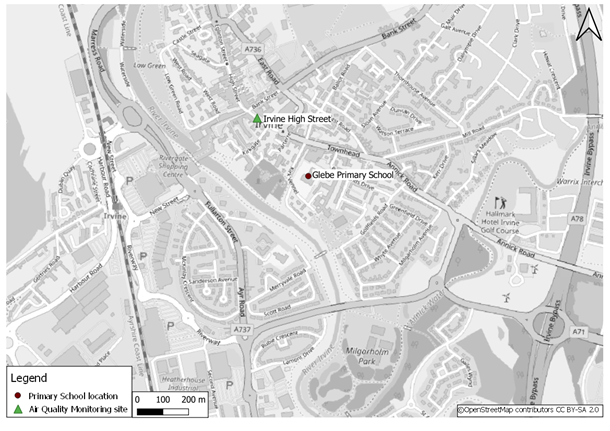
There is one Air Quality Monitoring Site (Scottish Air Quality Website) within 400m of the school, located on Irvine High Street. The Scottish Air Quality Database Annual Report for North Ayrshire (Scottish Air Quality Annual Report) presents the Mean for each of the following pollutants in 2021:
| Pollutant | Mean (μg m-3) |
|---|---|
|
NO2 |
12.6 |
| PM10 | 10.8 |
| PM2.5 | 6.0 |
| NO | 6.4 |
| Nox | 22.3 |
For NO2, PM10 and PM2.5, the concentrations were within the Low AQI band (Air Quality Standards) for all measured days in 2021.
East Ayrshire
Whatriggs Primary School, Kilmarnock
Context
School Role: 518 pupils
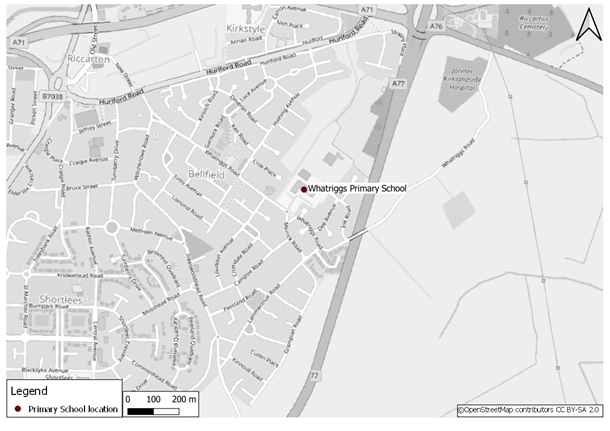
The school is situated in a residential environment, adjacent to the roundabout with Whatriggs and Merrick Road in the south east area of Kilmarnock. The A77 Kilmarnock Bypass is nearby to the east. The school can be accessed by bus from Whatriggs Road which is served by multiple bus services while the surrounding road network contains multiple pedestrian crossings and wide pavements. There is a large onsite staff and visitor car park.
Table A-5 below shows the travel to school mode share and indicates most pupils walk to school while the proportion of pupils being driven has increased slightly from 11.9% to 17%. The proportion of children cycling has risen slightly to 8.3% after peaking in 2019 while Park & Stride has remained stable over the years between 18.1% and 24.9% (Sustrans Hands Up Survey Website).
| Year | Walk | Cycle | Scooter/Skate | Park and Stride | Driven | Bus | Taxi | Other | Total |
|---|---|---|---|---|---|---|---|---|---|
| 2017 | 51.5% | 5.8% | 5.4% | 24.7% | 11.9% | * | * | 0% | 462 |
| 2018 | 39.6% | 10.5% | 9.7% | 19.7% | 18.3% | * | * | 1.6% | 497 |
| 2019 | 34.8% | 12.8% | 9.2% | 18.1% | 22% | * | 1.6% | * | 437 |
| 2020 | 44.5% | 7.1% | 5.2% | 24.9% | 16.6% | * | * | * | 465 |
| 2021 | 47.6% | 8.3% | 6.8% | 18.1% | 17% | 1.1% | * | * | 458 |
Where a percentage represents a value of between one and four pupils, it has been suppressed to maintain anonymity of respondents. In this case, values have been replaced with an asterisk (*).
Catchment Area
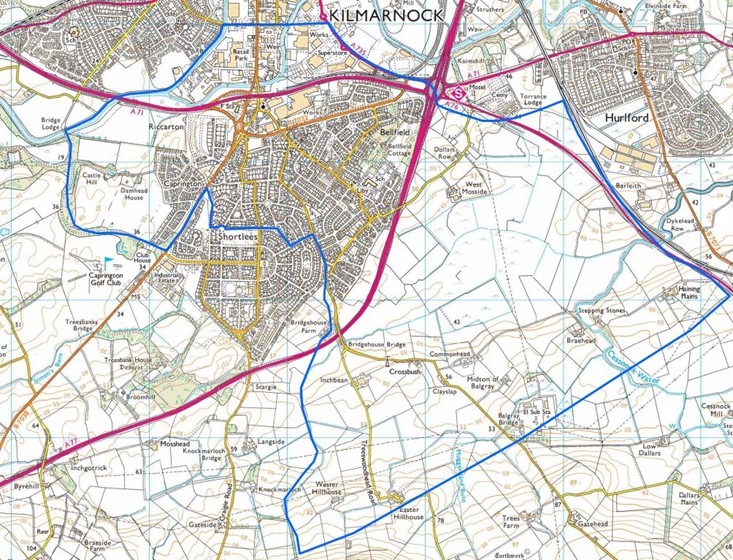
The catchment area covers a large extent of the southern residential areas in Kilmarnock as well as extending east towards Hurlford and south covering many rural areas.
Accident Data
There was a total of 4 accidents within 400m of the school between 2017 and 2021 (Department for Transport – Road Safety Data).
SIMD
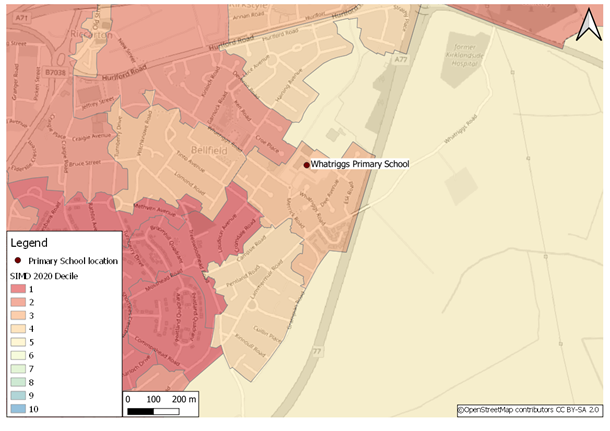
The school is located in an area of fairly high deprivation with the surrounding datazones generally between deciles 1 and 5 (SIMD Website).
Car or Van Availability
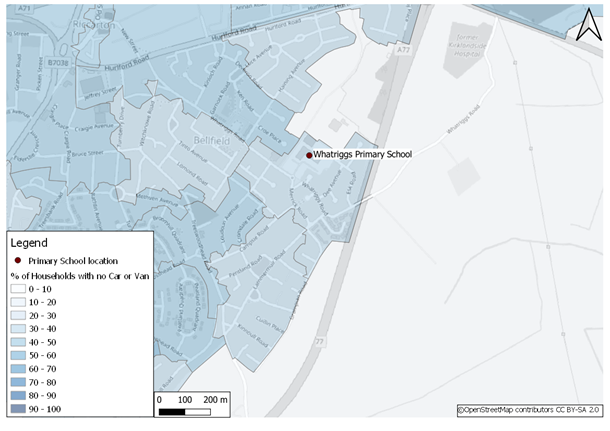
The surrounding area has fairly high levels of households with no car or van available with some links to the high levels of deprivation as illustrated in Figure A- 17. With the exception of the east, the surrounding residential areas recorded between 40 and 80% of households with no vehicle available (Scottish Census 2011).
Air Quality
There are no air quality monitoring sites within 400m of the school.
Mauchline Primary School, Mauchline
Context
School Role: 272 pupils
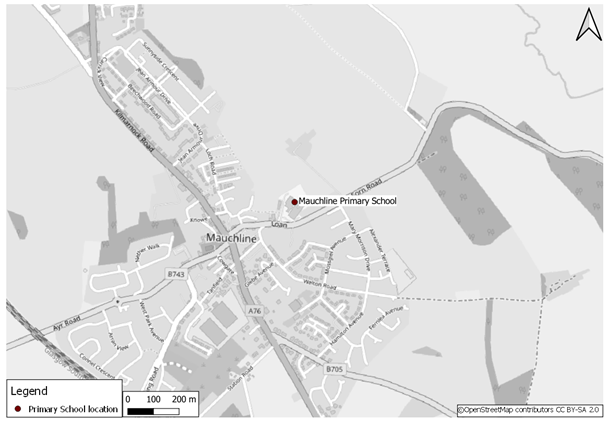
The school is located to the east of the town centre in residential environment, adjacent to Loan and Sorn Road. There are multiple pedestrian crossings and wide pavements in the surrounding area. The school is next to a local GP Surgery and is accessible to the A76 Kilmarnock Road via the Loan/High Street to the west. There is limited parking available onsite.
Table A-6 below shows the travel to school mode share and indicates most pupils walk to school with the proportion increasing steadily from 48.3% to 61.8%. The proportion of pupils being driven is lower and has decreased slightly from 21.7% to 19.5% while the levels of Park & Stride has also fallen. The proportion of children cycling has remained low after peaking at 9.1% in 2019 (Sustrans Hands Up Website).
| Year | Walk | Cycle | Scooter/Skate | Park and Stride | Driven | Bus | Taxi | Other | Total |
|---|---|---|---|---|---|---|---|---|---|
| 2017 | 48.3% | * | 1.9% | 17.6% | 21.7% | 6.4% | 2.6% | * | 267 |
| 2018 | 56.7% | 3.1% | * | 11% | 21.3% | 5.9% | * | 0% | 254 |
| 2019 | 52.4% | 9.1% | 2.8% | 9.8% | 17.7% | 7.1% | * | * | 254 |
| 2020 | 54.8% | 5.7% | * | 5.3% | 23.2% | 8% | * | * | 263 |
| 2021 | 61.8% | 4.1% | 2% | 4.1% | 19.5% | 8.5% | 0% | 0% | 246 |
Where a percentage represents a value of between one and four pupils, it has been suppressed to maintain anonymity of respondents. In this case, values have been replaced with an asterisk (*).
Catchment Area
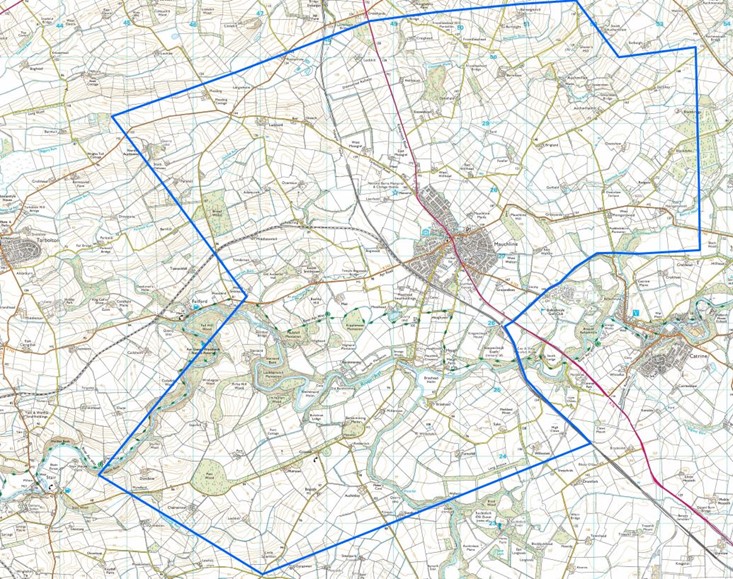
The catchment area covers the town of Mauchline and the surrounding areas comprising a mainly rural environment.
Accident Data
There was a total of 7 accidents within 400m of the school between 2017 and 2021 (Department for Transport – Road Safety data).
SIMD
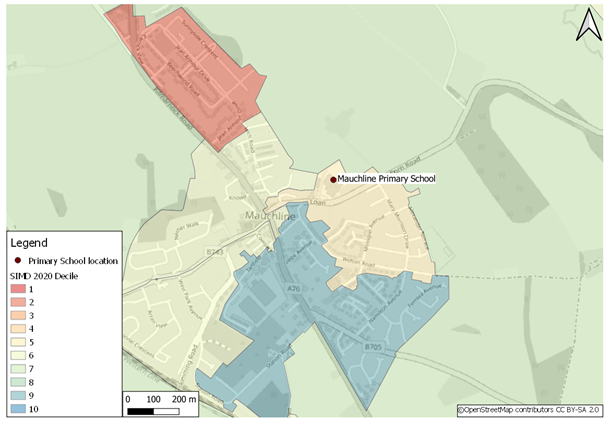
Deprivation levels in the surrounding area are mixed with high deprivation to the north west while the other areas around the school rank between 5 and 10 (SIMD Website).
Car or Van Availability
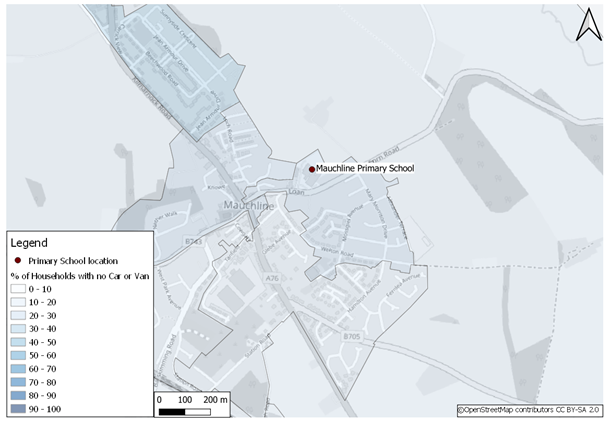
Car or van availability in the area is considered high with most surrounding zones containing between 10 and 30% with no vehicle available. In line with the SIMD data, the north west recorded highest levels of no car or van available at 40 to 50% (Scotland Census 2011).
Air Quality
There are no air quality monitoring sites within 400m of the school.
New Cumnock Primary School, New Cumnock
Context
School Role: 229 pupils
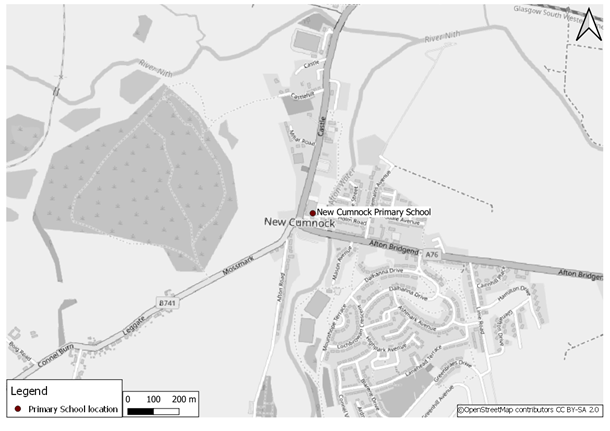
The school is located in a mixed residential and retail services environment on the A76 and B741 roundabout and next to the New Cumnock Early Childhood Centre. The school is near a range of services including a local convenience store and Outdoor Swimming Pool while being accessible by bus from the A76. There are wide pavements and a pedestrian crossing on the A76 near the school to assist with accessibility.
Table A-7 below shows the travel to school mode share and indicates a fairly even split between the proportion of pupils and being driven to school at the start of the time period before walking levels increased to 39.2% and pupils driven decreased from 29% to 19.6% during the time period. Park & Stride levels have remained fairly stable while a higher proportion of pupils travel by bus compared to other schools, despite this falling to 12% in 2021 (Sustrans Hands Up Survey).
| Year | Walk | Cycle | Scooter/Skate | Park and Stride | Driven | Bus | Taxi | Other | Total |
|---|---|---|---|---|---|---|---|---|---|
| 2017 | 37.2% | * | * | 14.8% | 29% | 14.8% | 3.3% | 0% | 183 |
| 2018 | 25.7% | 3.5% | * | 21.3% | 34.2% | 5.9% | 8.4% | * | 202 |
| 2019 | 36.6% | 3.8% | * | 15.3% | 26.8% | 9.8% | 3.8% | * | 183 |
| 2020 | 42.9% | 3.4% | * | 13.7% | 23.4% | 11.2% | 3.9% | * | 205 |
| 2021 | 39.2% | 5.5% | * | 20.1% | 19.6% | 12.1% | * | * | 199 |
Where a percentage represents a value of between one and four pupils, it has been suppressed to maintain anonymity of respondents. In this case, values have been replaced with an asterisk (*).
Catchment Area
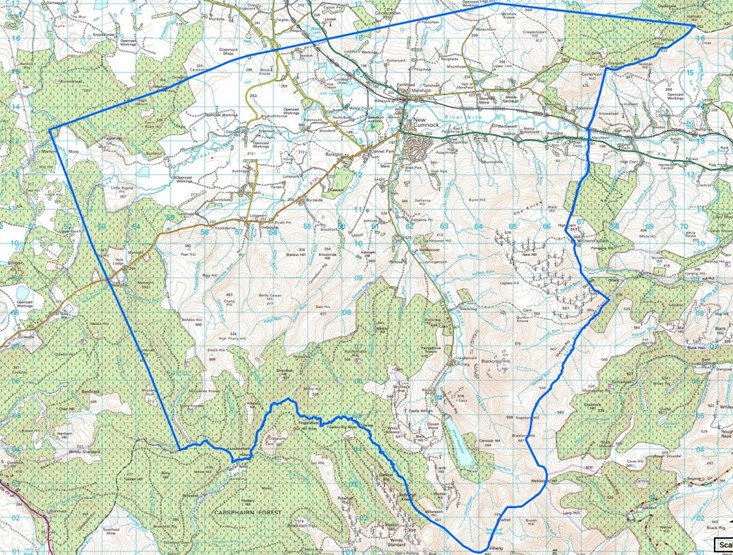
The catchment area covers the town of New Cumnock and the surrounding rural areas, including the Carsphairn Forest.
Accident Data
There was a total of 5 accidents within 400m of the school between 2017 and 2021 (Department for Transport – Road Safety Data).
SIMD
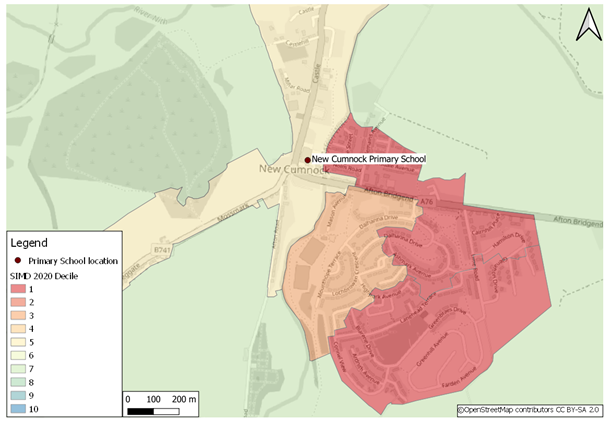
Deprivation levels in the surrounding area are mixed with high deprivation immediately east and in parts of the south while the centre of New Cumnock, west and further east rank between 5 and 7 (SIMD Website).
Car or Van Availability
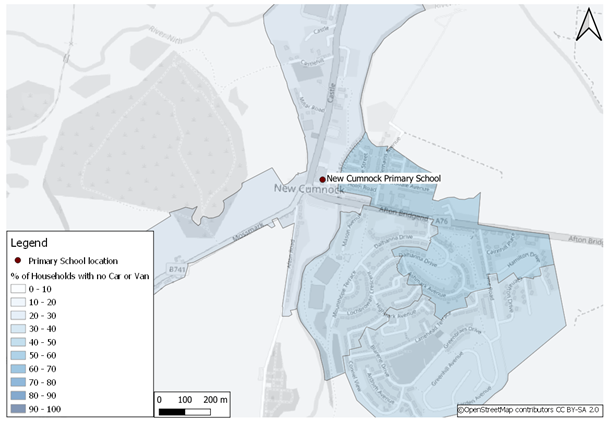
Car or van availability in the area is mixed with zones in the south east of New Cumnock recording 40 to 80% of households with no vehicle available while in the north and in the rural extents outwith the town, car or van availability is higher (Scotland Census 2011).
Air Quality
There are no air quality monitoring sites within 400m of the school.
South Ayrshire
Coylton Primary School, Coylton
Context
School Role: 265 pupils
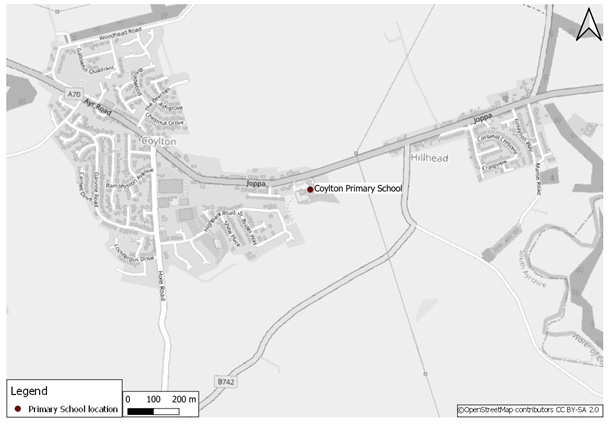
The school is located to the east of the town centre and large residential area, on the A70. There are wide pavements along the A70 and a pedestrian crossing to aid accessibility to the school while bus services serve bus stops directly north of the site. A car park for staff and visitors is present.
Table A-8 below shows the travel to school mode share and shows that walking is the most common mode, although this fell from 39.1% to 28.7% between 2018 and 2019. Pupils being driven was lower but did increase from 20.2% to 24.2% while the number of Park & Stride is similar over the same period. The combined proportion of pupils being driven the full journey and Park & Stride suggests most pupils are driven at least part of the journey to school. Bus travel saw an increase from 9.4% to 13.5% while cycling also grew slightly (Sustrans Hands Up Website).
| Year | Walk | Cycle | Scooter/Skate | Park and Stride | Driven | Bus | Taxi | Other | Total |
|---|---|---|---|---|---|---|---|---|---|
| 2017 | No data | No data | No data | No data | No data | No data | No data | No data | No data |
| 2018 | 39.1% | 2.1% | * | 24.5% | 20.2% | 9.4% | 3.4% | * | 233 |
| 2019 | 28.7% | 4.9% | 4.5% | 21.3% | 24.2% | 13.5% | 2.9% | 0% | 244 |
| 2020 | No data | No data | No data | No data | No data | No data | No data | No data | No data |
| 2021 | No data | No data | No data | No data | No data | No data | No data | No data | No data |
Where a percentage represents a value of between one and four pupils, it has been suppressed to maintain anonymity of respondents. In this case, values have been replaced with an asterisk (*).
Catchment Area
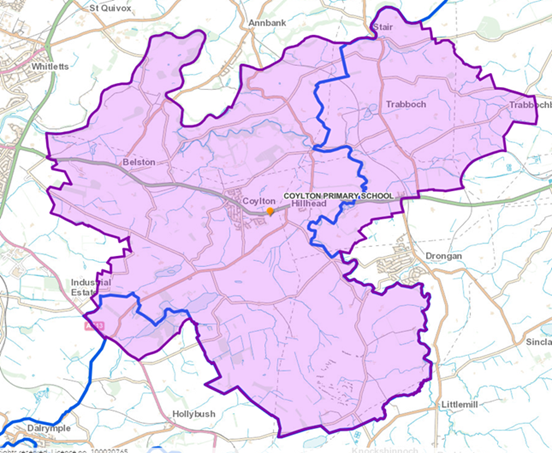
The catchment area extends west towards Whitletts while the east and south of the area covers parts of East Ayrshire. The environment covered is predominately rural with the exception of Coylton and some small villages (South Ayrshire Council – School Catchments).
Accident Data
There was a total of 1 accident within 400m of the school between 2017 and 2021 (Department of Transport – Road Safety Data).
SIMD
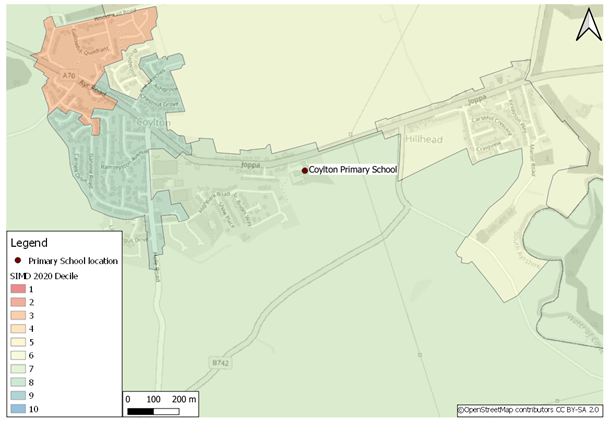
The area around the school has average levels of deprivation with a small area of higher deprivation in the north west of the town while the other datazones, including immediately adjacent to the school, fall between deciles 5 and 8 (SIMD Website).
Car or Van Availability
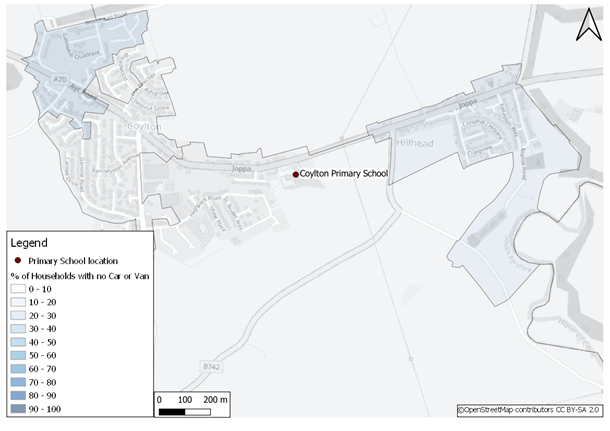
Car or van availability in the area is high, with all datazones, except for one in the north west, recording 0 to 20% of households with no vehicle available. This likely attributed to the rural location of Coylton while there is also a link with the SIMD rankings (Scotland Census 2011).
Air Quality
There are no air quality monitoring sites within 400m of the school.
Doonfoot Primary School, Ayr
Context
School Role: 229 pupils
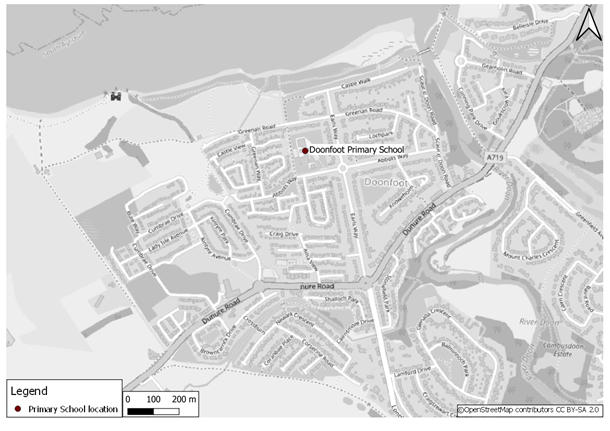
The school is located in a residential area to the south of Ayr, near the A719. There are wide pavements on the roads leading into the school. There is a small staff car park, which pupils have to cross via a zebra crossing to access the school building from the playing fields.
Table A-9 below shows the travel to school mode share and indicates a fairly even split between the proportion of pupils walking, driven and Park & Stride. The number of pupils walking remained stable between 28.7% and 29.9% while Park & Stride seen a rise from 23.4% to 31.7% and pupils driven fell slightly to 26.3%. The number of pupils cycling increased slightly from 5.3% to 6.9% while those scooting/skating fell from 12.8% to 4.8% (Sustrans Hands Up Website).
| Year | Walk | Cycle | Scooter/Skate | Park and Stride | Driven | Bus | Taxi | Other | Total |
|---|---|---|---|---|---|---|---|---|---|
| 2017 | 28.7% | 5.3% | 12.8% | 23.4% | 29.4% | 0% | * | * | 265 |
| 2018 | 30.2% | 7.1% | 7.1% | 33.1% | 21% | * | * | 0% | 281 |
| 2019 | 29.9% | 6.9% | 4.8% | 31.7% | 26.3% | 0% | * | * | 331 |
| 2020 | No data | No data | No data | No data | No data | No data | No data | No data | No data |
| 2021 | No data | No data | No data | No data | No data | No data | No data | No data | No data |
Where a percentage represents a value of between one and four pupils, it has been suppressed to maintain anonymity of respondents. In this case, values have been replaced with an asterisk (*).
Catchment Area
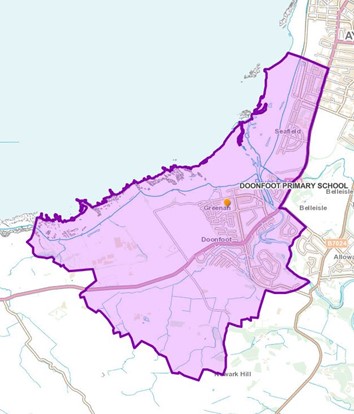
The catchment area covers the Doonfoot Area in the south east of Ayr and neighbouring Seafield. The catchment covers the rural environment to the west of Doonfoot (South Ayrshire Council – School Catchments).
Accident Data
There was a total of 2 accidents within 400m of the school between 2017 and 2021 (Department for Transport – Road Safety Data).
SIMD
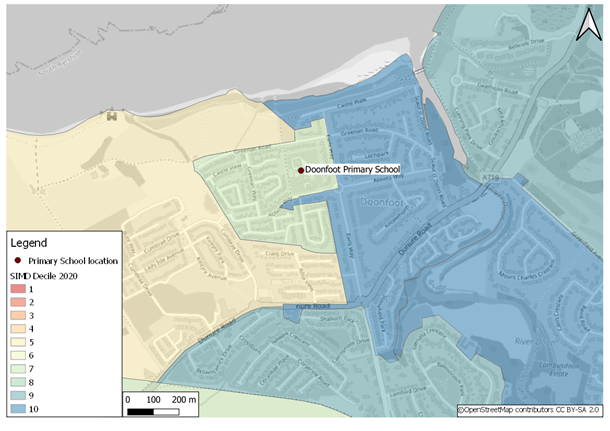
Deprivation levels around the school are low with all datazones adjacent to, south and east of the school between deciles 6 and 10 while the datazone further west deprivation is within decile 5 (SIMD Website).
Car or Van Availability
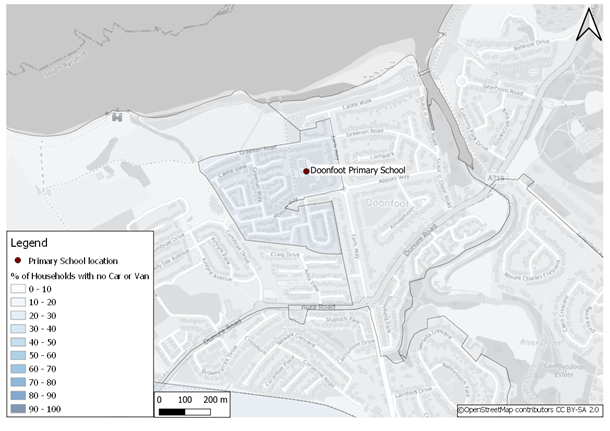
Car or van availability is high in the area with 0 to 20% of households in the area having no access to a car or van (Scotland Census 2011).
Air Quality
There are no air quality monitoring sites within 400m of the school.
Forehill Primary School, Ayr
Context
School Role: 454 pupils
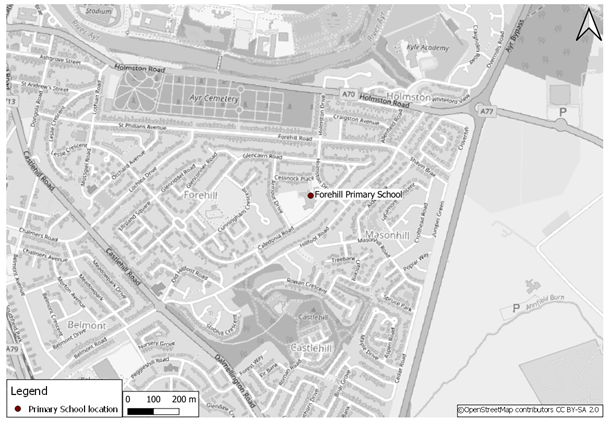
The school is located in a residential environment adjacent to Cessnock Place and Holmston Drive while being immediately adjacent to the Forehill Early Years Centre. The school can be accessed by bus from stops on Holmston Drive and Caledonia Road. Staff and visitor parking is present on site and there are traffic calming measures in place on the surrounding residential streets.
Table A-10 below shows the travel to school mode share and indicates walking has been the most popular mode with a slight increase from 41.3% to 45.4%. Pupils being driven to school also grew slightly after falling to 17.1% in 2019 while Park & Stride decreased steadily from 27.5% to 15.2% over the time period. The proportion of pupils cycling fell from 5.2% to 4.7% while scooting/skating also fell (Sustrans Hands Up Survey).
| Year | Walk | Cycle | Scooter/Skate | Park and Stride | Driven | Bus | Taxi | Other | Total |
|---|---|---|---|---|---|---|---|---|---|
| 2017 | 41.3% | 5.2% | 4.2% | 27.5% | 21.8% | 0% | 0% | 0% | 404 |
| 2018 | 35.2% | 2.6% | 4.8% | 26.6% | 29.9% | * | * | 0% | 421 |
| 2019 | 49% | 1.5% | 3.7% | 26.1% | 17.1% | * | 2.2% | * | 410 |
| 2020 | 48.7% | * | 2.1% | 19.6% | 29.1% | 0% | 0% | * | 433 |
| 2021 | 45.4% | 4.7% | 2.1% | 15.2% | 31.9% | 0% | * | * | 427 |
Where a percentage represents a value of between one and four pupils, it has been suppressed to maintain anonymity of respondents. In this case, values have been replaced with an asterisk (*).
Catchment Area
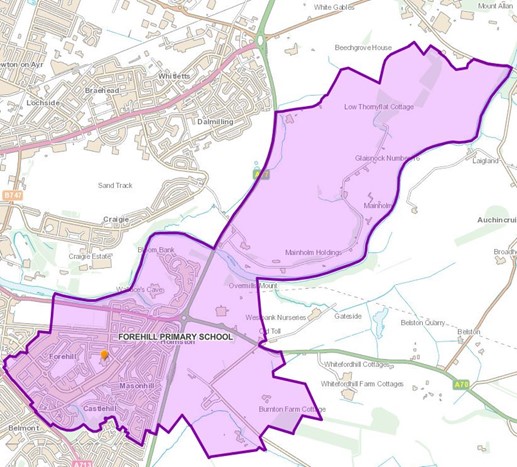
The catchment area covers the Forehill, Masonhill and Castlehill areas in West Ayr as well as extending north east beyond the A77 to cover a predominately rural area (South Ayrshire Council – School Catchments).
Accident Data
There was a total of 2 accidents within 400m of the school between 2017 and 2021 (Department for Transport – Road Safety Data).
SIMD
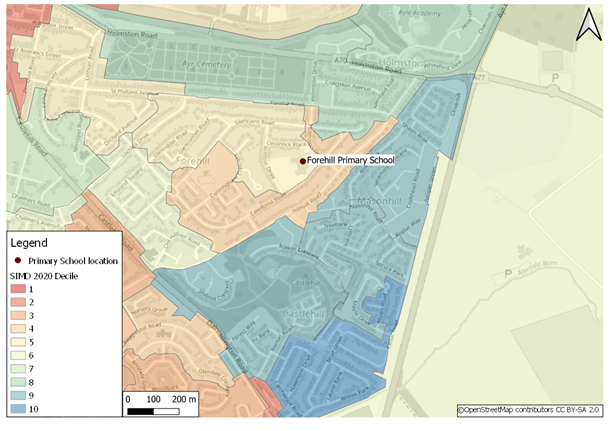
The school is located in an area of varying deprivation levels with datazones in the south east between deciles 8 and 10 while the immediate area around the school recorded higher deprivation with a decile between 4 and 5. The north west of the area recorded the highest deprivation (SIMD Website).
Car or Van Availability
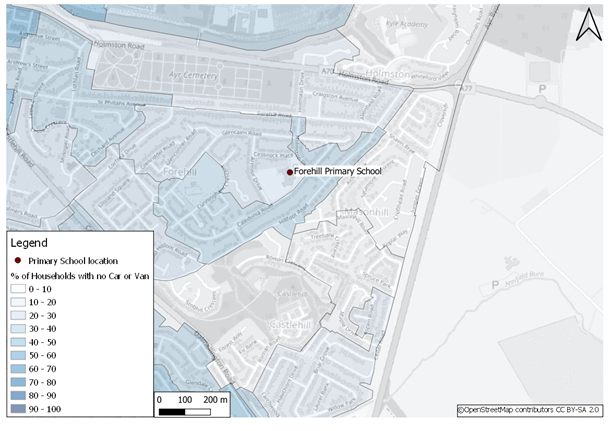
Car or van availability in the area is mixed with most of the west and parts of the north and south recording levels of 60 to 100% of households with no access to a vehicle while to the east and beyond the A77 car or van availability is higher with many zones recording between 0 and 10% of households with no vehicle. This corresponds with the SIMD data, with more deprived areas less likely to have access to a car or van (Scotland Census 2011).
Air Quality
There are no air quality monitoring sites within 400m of the school.