Analysis
About the respondents
Transport Scotland received a total of 97 responses. These were received via feedback form, virtual exhibition room and email. The breakdown of responses is detailed in Table 1.
| Method of response | No. of responses |
|---|---|
| Feedback form (hard copy) | 36 |
| Feedback form (virtual copy) | 51 |
| 10 | |
| Total | 97 |
Email responses received from individuals, groups or organisations were summarised and are included in Appendix G of this report.
Coding of free text responses
The feedback form contained four questions, each of which invited free text responses. Such responses can be complex to analyse but offer valuable insight, as respondents can choose to focus on certain topics related to the question and provide any length of response.
Responses were analysed through a method of processing known as coding. Coding focuses on the themes among the responses. When reading through the responses, themes become clear, and these themes become codes within a code frame. A code frame lists the themes and then lists the codes relevant to each theme. For example, where the theme is ‘cycling’, responses which are ‘supportive of cyclists’ could be coded as ‘CYC_001’ while responses which are ‘unsupportive of cyclists’ could be coded as ‘CYC_002’. Depending on factors such as the content, number and length of responses relevant to each theme, the code frame can vary in size.
The code frame was reviewed, and quality checked to make sure no themes, responses, comments or codes were unaccounted for.
Demographic data
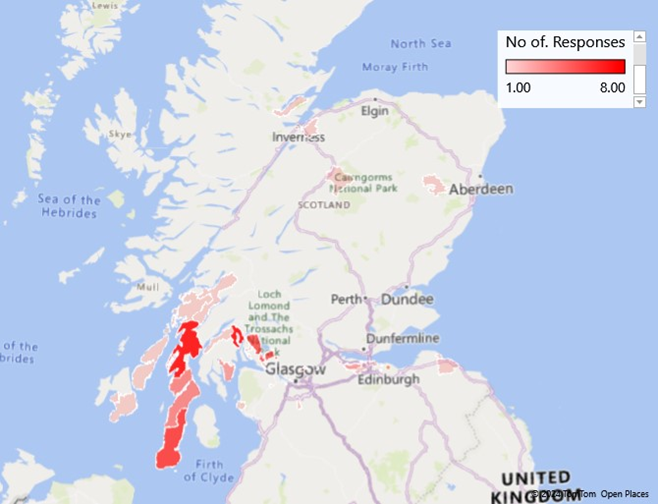
Based on the postcodes provided on the feedback forms, the postcodes with the highest number of responses were shared between G84, PA31 and PA24 with eight responses each. The distribution of responses by postcode can be seen in Map 1.