Smart ticketing, payment and other ticket types
63% of respondents had used a smartcard in the past. 58% of these were not aware that smartcards were interoperable.
In the survey, ‘interoperable’ was defined as the ability to:
load one operator's ticket onto another smartcard. For example, a Stagecoach ticket onto your ScotRail smartcard, or Glasgow Subway ticket/Pay As You Go credit onto your National Entitlement Card.”
12% of those who had used a smartcard had used them in this way. 78% of those who indicated they were not aware that smartcards were interoperable would take advantage of this ability in future.
Satisfaction with smart ticketing was high overall, especially among users of bus/coach (61%) and train (60%).
Respondents were asked how satisfied they were with smart ticketing and payments on different modes of transport. The results for people who had used each mode in the previous year are shown in Chart 13. It is important to note that the number of respondents who were users of bike hire schemes or car clubs in the previous year was very low: 69 people had used bike hire schemes, while 31 had used car clubs.
Satisfaction with smart ticketing was high overall, especially among users of bus/coach (61%) and train (60%). For most other modes, respondents were more satisfied than dissatisfied with smart ticketing. However, for ferries 33% of users were dissatisfied with smart ticketing, and 20% were satisfied, but this survey was undertaken before CalMac introduced their new Ar Turas ticketing system, which now provides electronic e-tickets. More detail on these results is available in Annex Table 10.
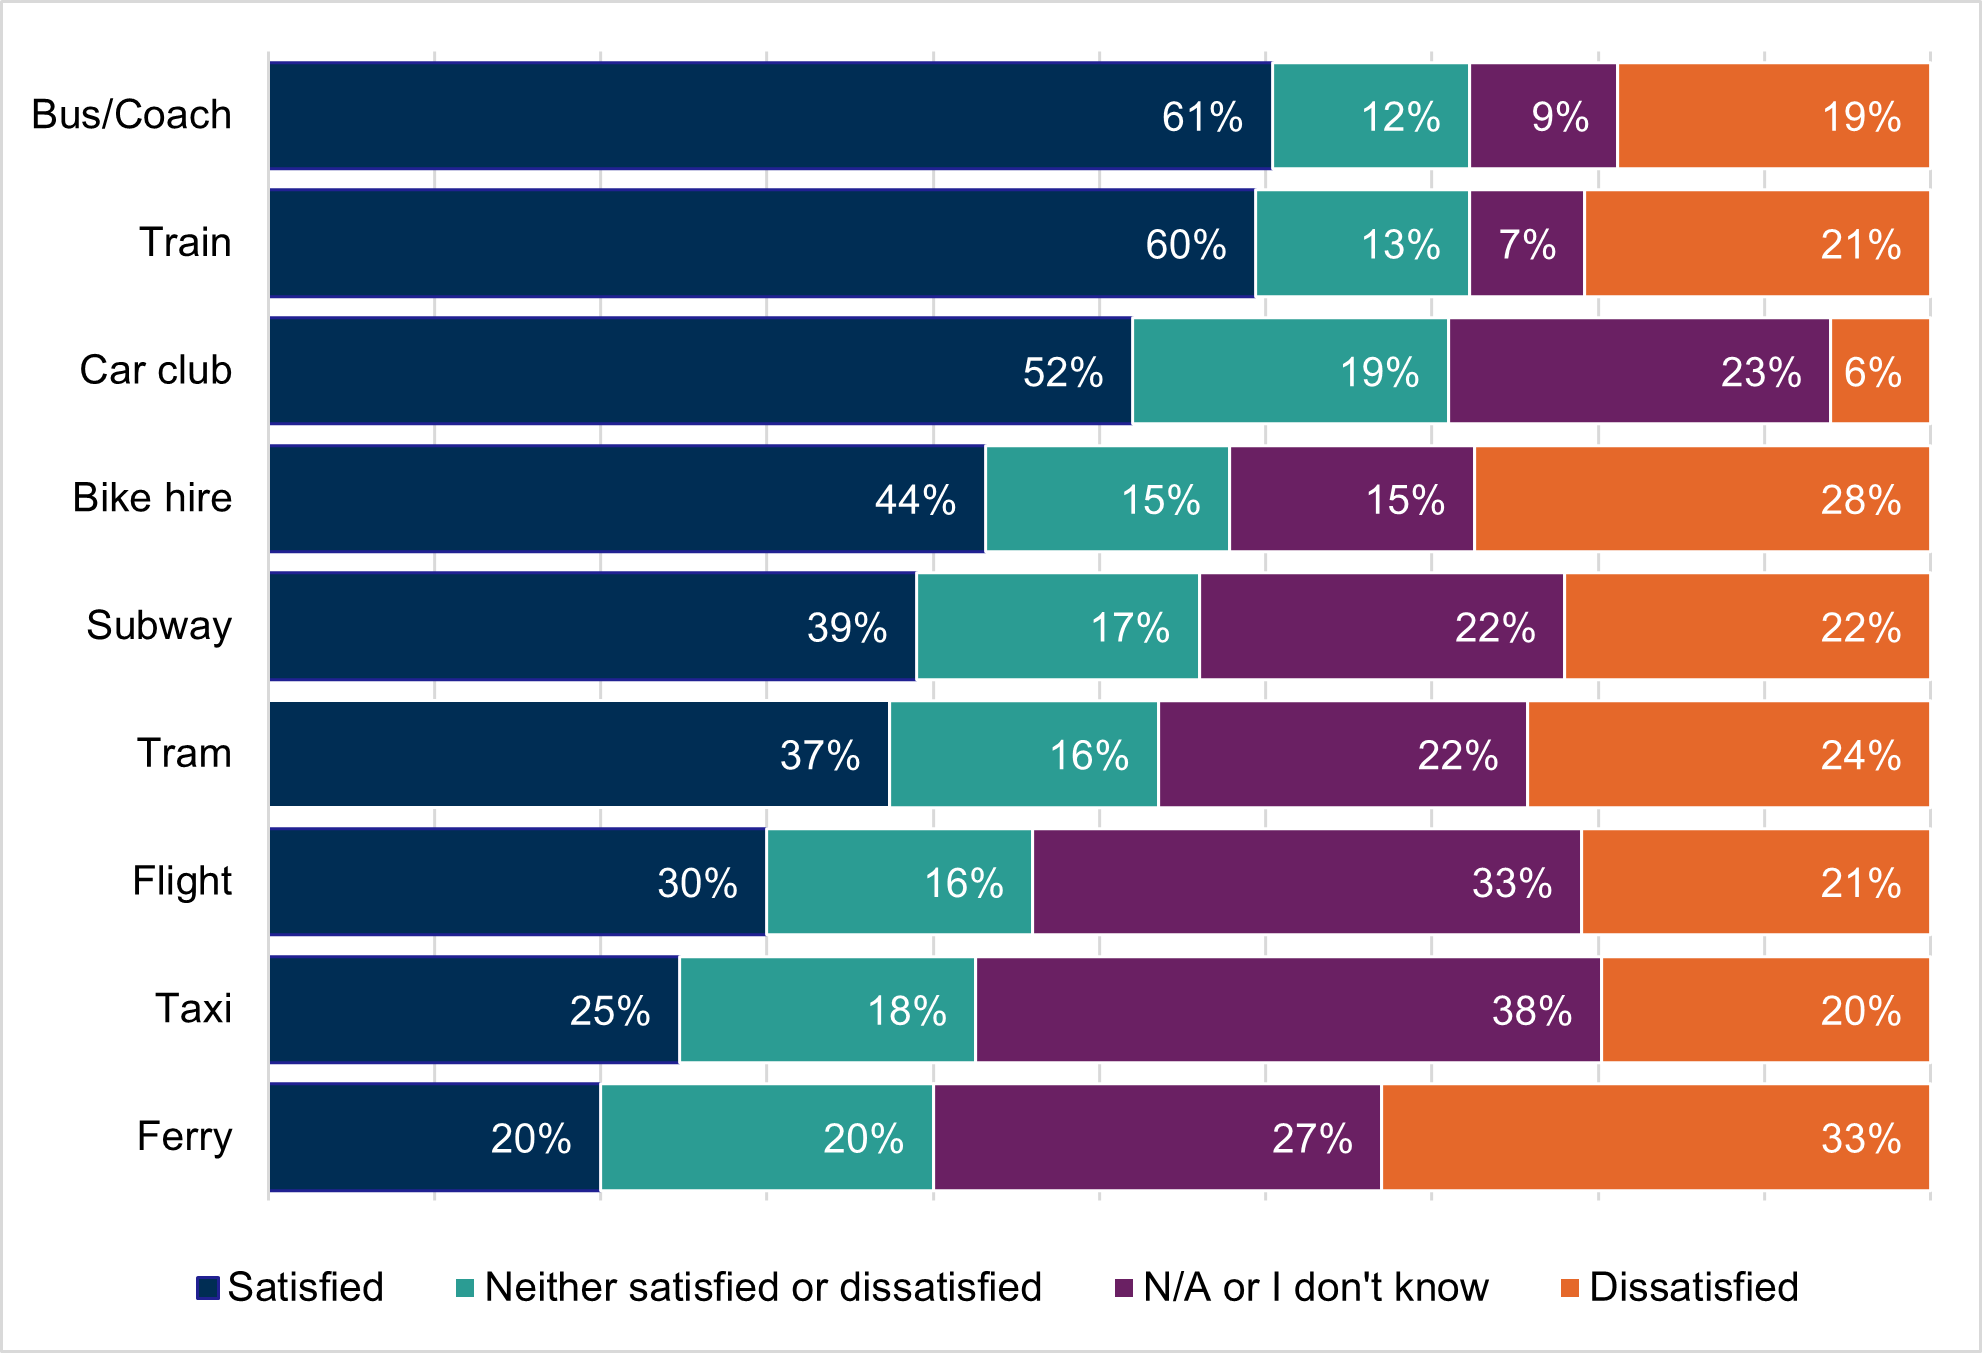
The legend is presented in the same order as the categories within the bars.
Respondents were also asked what ticket types they had used in the year before the survey, and compared this with the ticket types they would like to use in future. Across all modes, over two-thirds (67%) had used paper tickets bought by contactless, which was the most frequently used ticket type. The least frequently used ticket type in the year before the survey was pay-as-you-go (PAYG) smartcard, used by only 13% of respondents.
In the table, “Digital ticket” refers to tickets available on an app, as an m-ticket or as an e-ticket. “Contactless – TO(TO)” refers to paying for travel using a tap-on (and in some cases, tap-off) system, where no ticket is issued, and travel is charged at the end of the day or week.
Most people would like to use digital tickets (64%) or contactless payment Tap On (Tap off) (56%) in the next year.
28% of respondents would like to continue using paper tickets bought by contactless. For all modes apart from train, aviation and car clubs, respondents would most prefer to use a different ticket type to one they had used previously.
| Ticket Type | Used in past 12 months across all modes & among all respondents | Preference for future non-concessionary travel across all modes & among all respondents |
|---|---|---|
| Smartcard for concessionary travel | 23% | Not applicable |
| Smartcard - with pre-purchased ticket | 25% | 40% |
| Smartcard - pre-loaded with money (Pay As You Go) | 13% | 30% |
| Contactless - paper ticket | 67% | 41% |
| Contactless - TO(TO) | 39% | 56% |
| Digital ticket | 62% | 64% |
| Paper ticket (not bought by contactless) | 47% | 28% |
| Mode | Past 12 months: Most common ticket type among users of that mode | % who had used it | Future: Preferred ticket type among all respondents | % who would like to use it | Future: 2nd most preferred ticket type among all respondents | % who would like to use it |
|---|---|---|---|---|---|---|
| Bus/Coach | Contactless - paper ticket | 43% | Contactless - TO(TO) | 52% | Digital ticket | 50% |
| Train | Digital ticket | 50% | Digital ticket | 56% | Contactless - TO(TO) | 47% |
| Subway | Contactless - paper ticket | 21% | Contactless - TO(TO) | 35% | Digital ticket | 30% |
| Tram | Contactless - paper ticket | 22% | Contactless - TO(TO) | 31% | Digital ticket | 27% |
| Ferry (foot/cycle) | Paper ticket (not bought by contactless) | 14% | Digital ticket | 21% | Contactless - TO(TO) | 16% |
| Ferry (vehicle user) | Paper ticket (not bought by contactless) | 19% | Digital ticket | 19% | Contactless - TO(TO) | 13% |
| Aviation (within Scotland) | Digital ticket | 6% | Digital ticket | 16% | Contactless - TO(TO) | 8% |
| Taxi | Contactless - paper ticket | 11% | Contactless - TO(TO) | 13% | Digital ticket | 12% |
| Bike hire scheme | Digital ticket | 11% | Contactless - TO(TO) | 11% | Digital ticket | 9% |
| Car club | Digital ticket | 13% | Digital ticket | 7% | Contactless - TO(TO) | 7% |
It is important to note that the people who would like to use a given payment method on a particular mode are not necessarily the people who had used that mode previously.
Table 4 compares how respondents in different regions ranked each ticket type in order of preference, where 1=most preferred and 6=least preferred. Across all modes in accessible areas, large cities and urban areas, the two most popular ticket types were contactless – TO(TO) and digital.
For remote areas, the most popular ticket type for all modes was digital, then smartcards loaded with pre-purchased tickets, with contactless – TO(TO) tickets ranking third. This may reflect that more journeys in remote areas are purchased in advance, or public transport journeys are less frequently taken, or include less stages.
Paper tickets not bought by contactless were the least popular ticket type in large cities and urban areas. PAYG smartcards were the least popular ticket type in accessible and remote areas. The proportion of respondents in each area who chose each option is also presented in Table 4. The most popular option in each region is highlighted.
| Ticket type | Accessible rank | Accessible % | Large City rank | Large City % | Remote rank | Remote % | Urban rank | Urban % |
|---|---|---|---|---|---|---|---|---|
| Smartcard - loaded with pre-purchased ticket | 4th | 9.8% | 5th | 8% | 2nd | 15% | 4th | 7% |
| PAYG smartcard | 6th | 7.6% | 3rd | 9.3% | 6th | 9% | 5th | 6% |
| Contactless - paper ticket | 3rd | 10.3% | 4th | 8.8% | 5th | 11% | 3rd | 10% |
| Contactless - TO(TO) | 2nd | 12% | 1st | 18.3% | 3rd | 14% | 2nd | 12% |
| Digital ticket | 1st | 19% | 2nd | 17.6% | 1st | 25% | 1st | 18% |
| Paper ticket (not bought by contactless) | 5th | 8.2% | 6th | 5% | 4th | 13% | 6th | 4% |
Disabled respondents were more favourable towards smartcards loaded with pre-purchased tickets and PAYG smartcards, particularly for flights and taxi journeys. This is shown in Chart 14 and Annex Table 11. Revisiting the findings for modal choice, there does not appear to be any relationship between preference towards ticket types, and frequency with which disabled and non-disabled people use each of these modes.
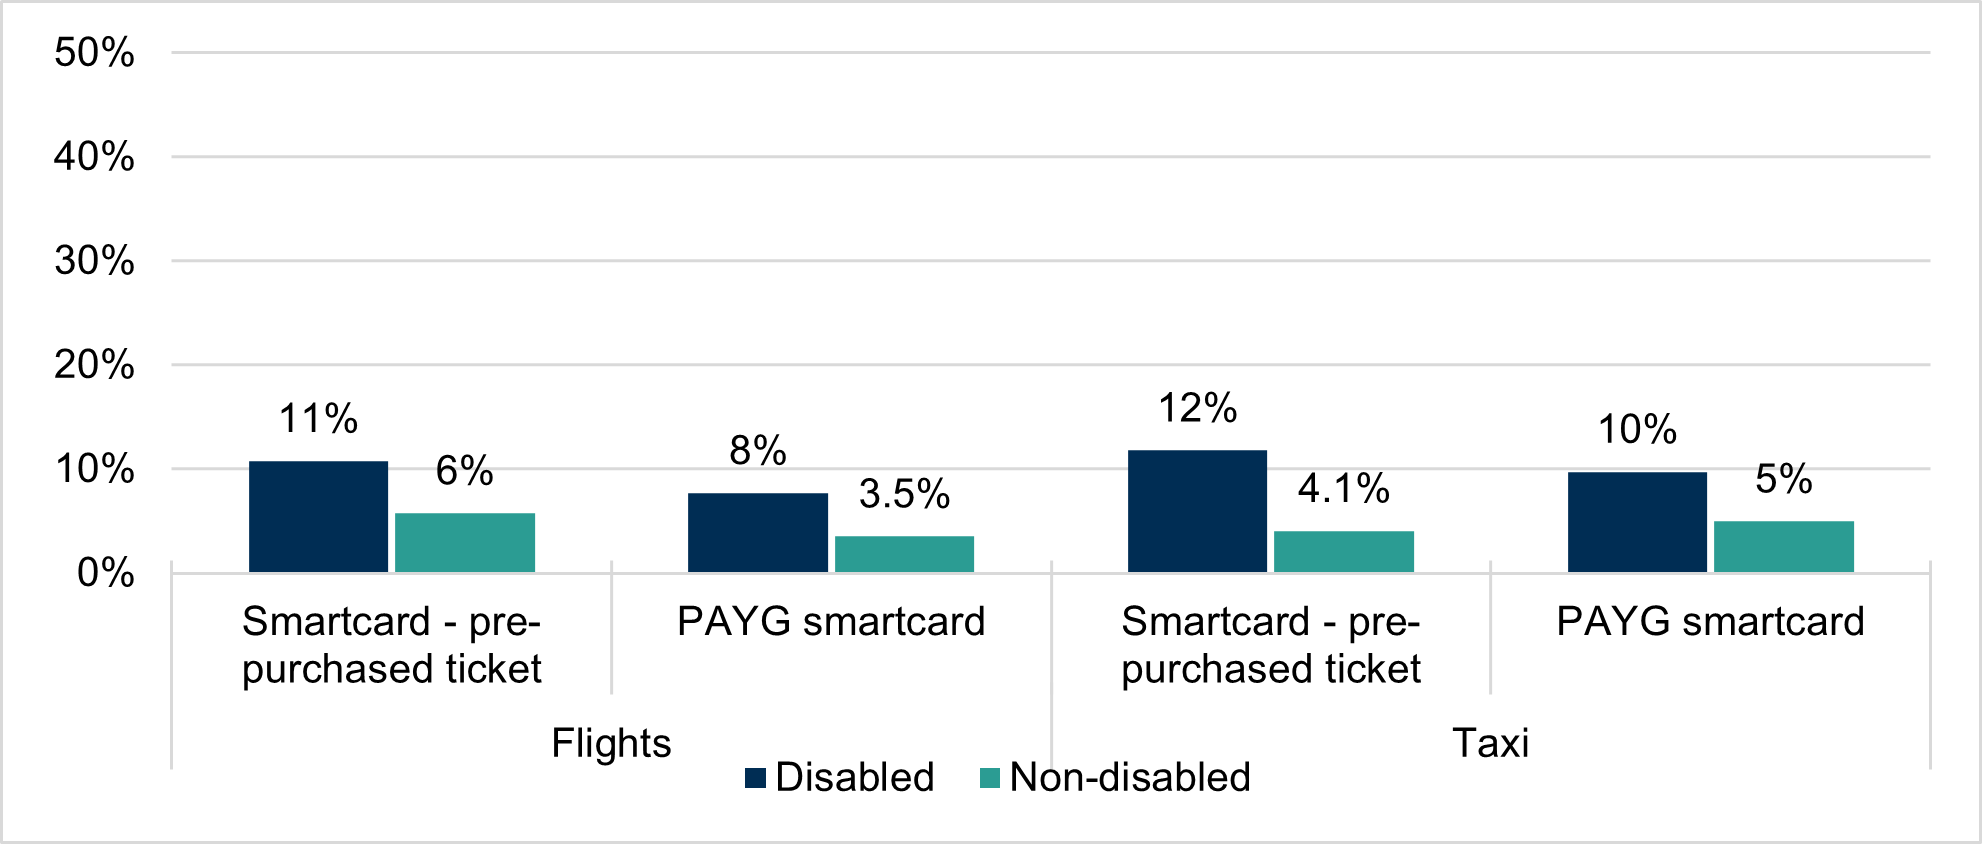
The legend is presented in the same order as the bars in the clusters.
Those aged 60+ were more favourable than other age groups towards paper tickets not bought by contactless for all modes. While paper tickets were the least popular type for people aged 16-59, PAYG smartcards were the least popular type of ticket for those aged 60+.
Travel using the National Concessionary Scheme
The 259 respondents who used national concessionary travel schemes (NCT) were asked what devices they would like to use for this.
81% of users of national concessionary travel schemes would be satisfied to continue using their National Entitlement Card. Almost two-thirds (64%) would like to use the scheme on their phone, while 22% would like their concessionary travel to be available on wearable technology.
Disaggregating the results by age, wearable devices were much more popular among younger NCT users: 56% of those aged 16-32 would use the scheme on a wearable device, compared with 22% of 33-59 year olds, and 13% of those aged 60+. This is shown in Chart 15. The data for charts 15-18 is also available in Annex Table 12.
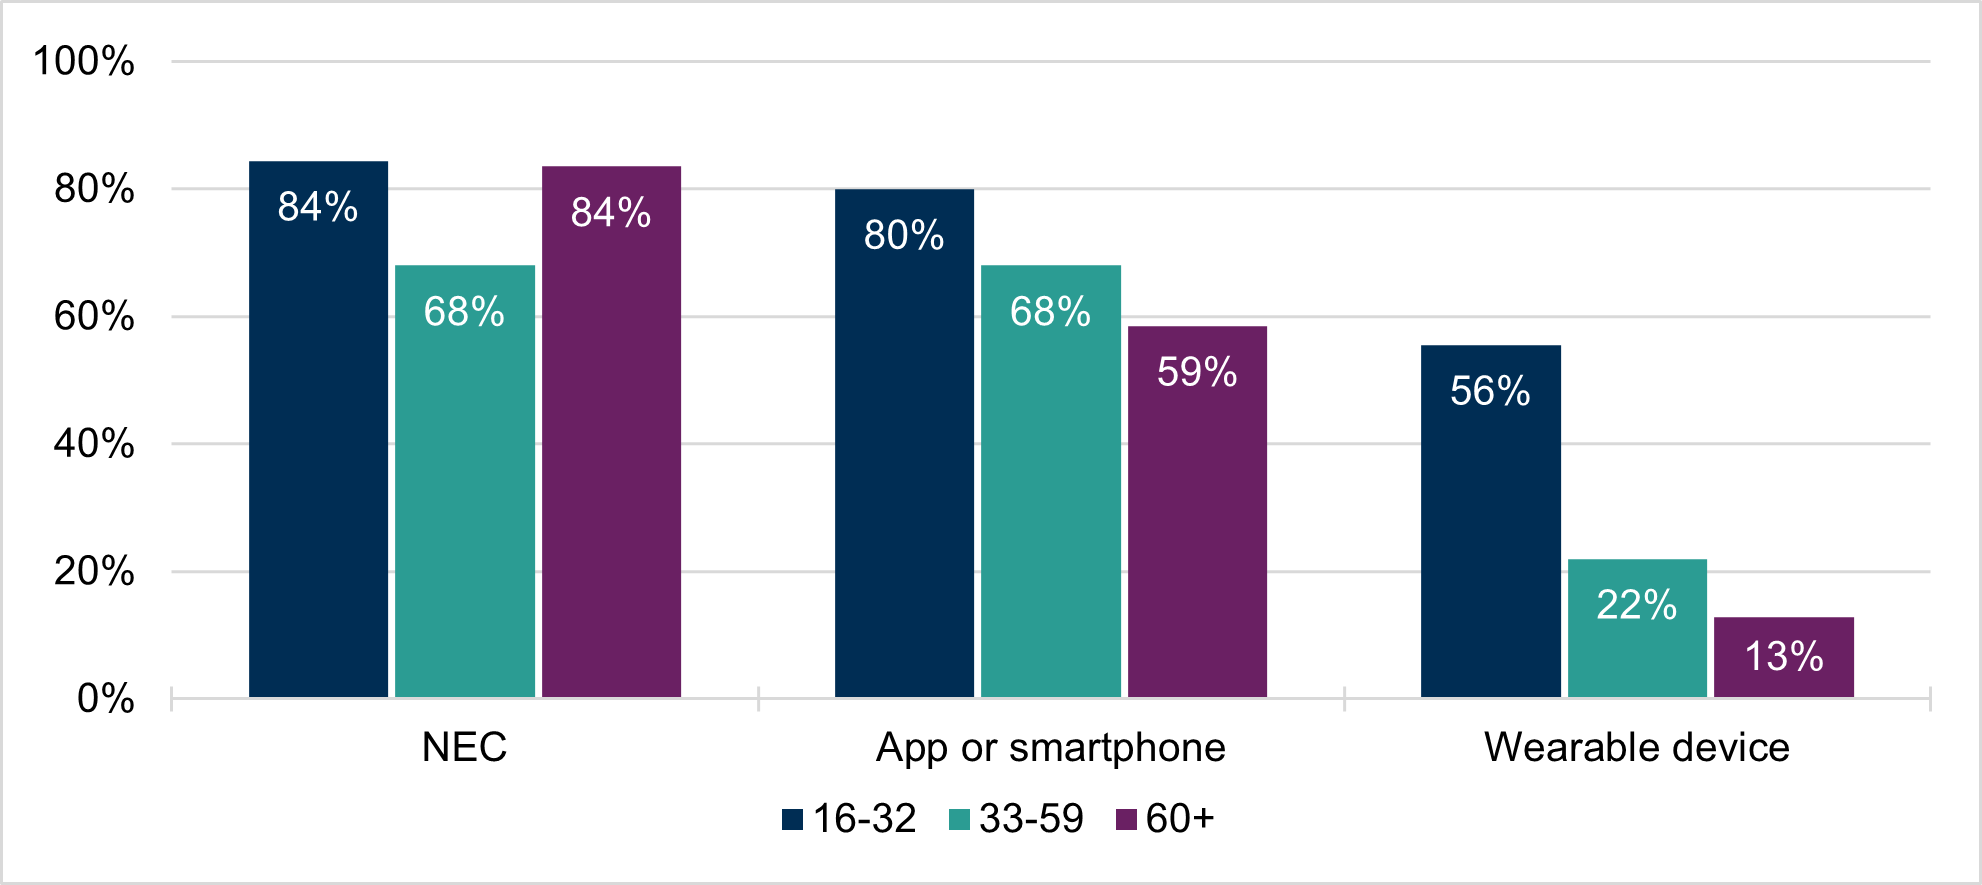
The legend is presented in the same order as the bars in the clusters.
There is more variation by region, especially for mobile apps/smartphones, as shown in Chart 17. 81% of people in urban areas would like the NCT to be available on their phones. This is compared to 71% of people in large cities, 59% of people in accessible areas, and 44% of people in remote areas. (See Chart 6 or Annex Table 4 for data on access to smartphones and other payment technologies in these areas.)
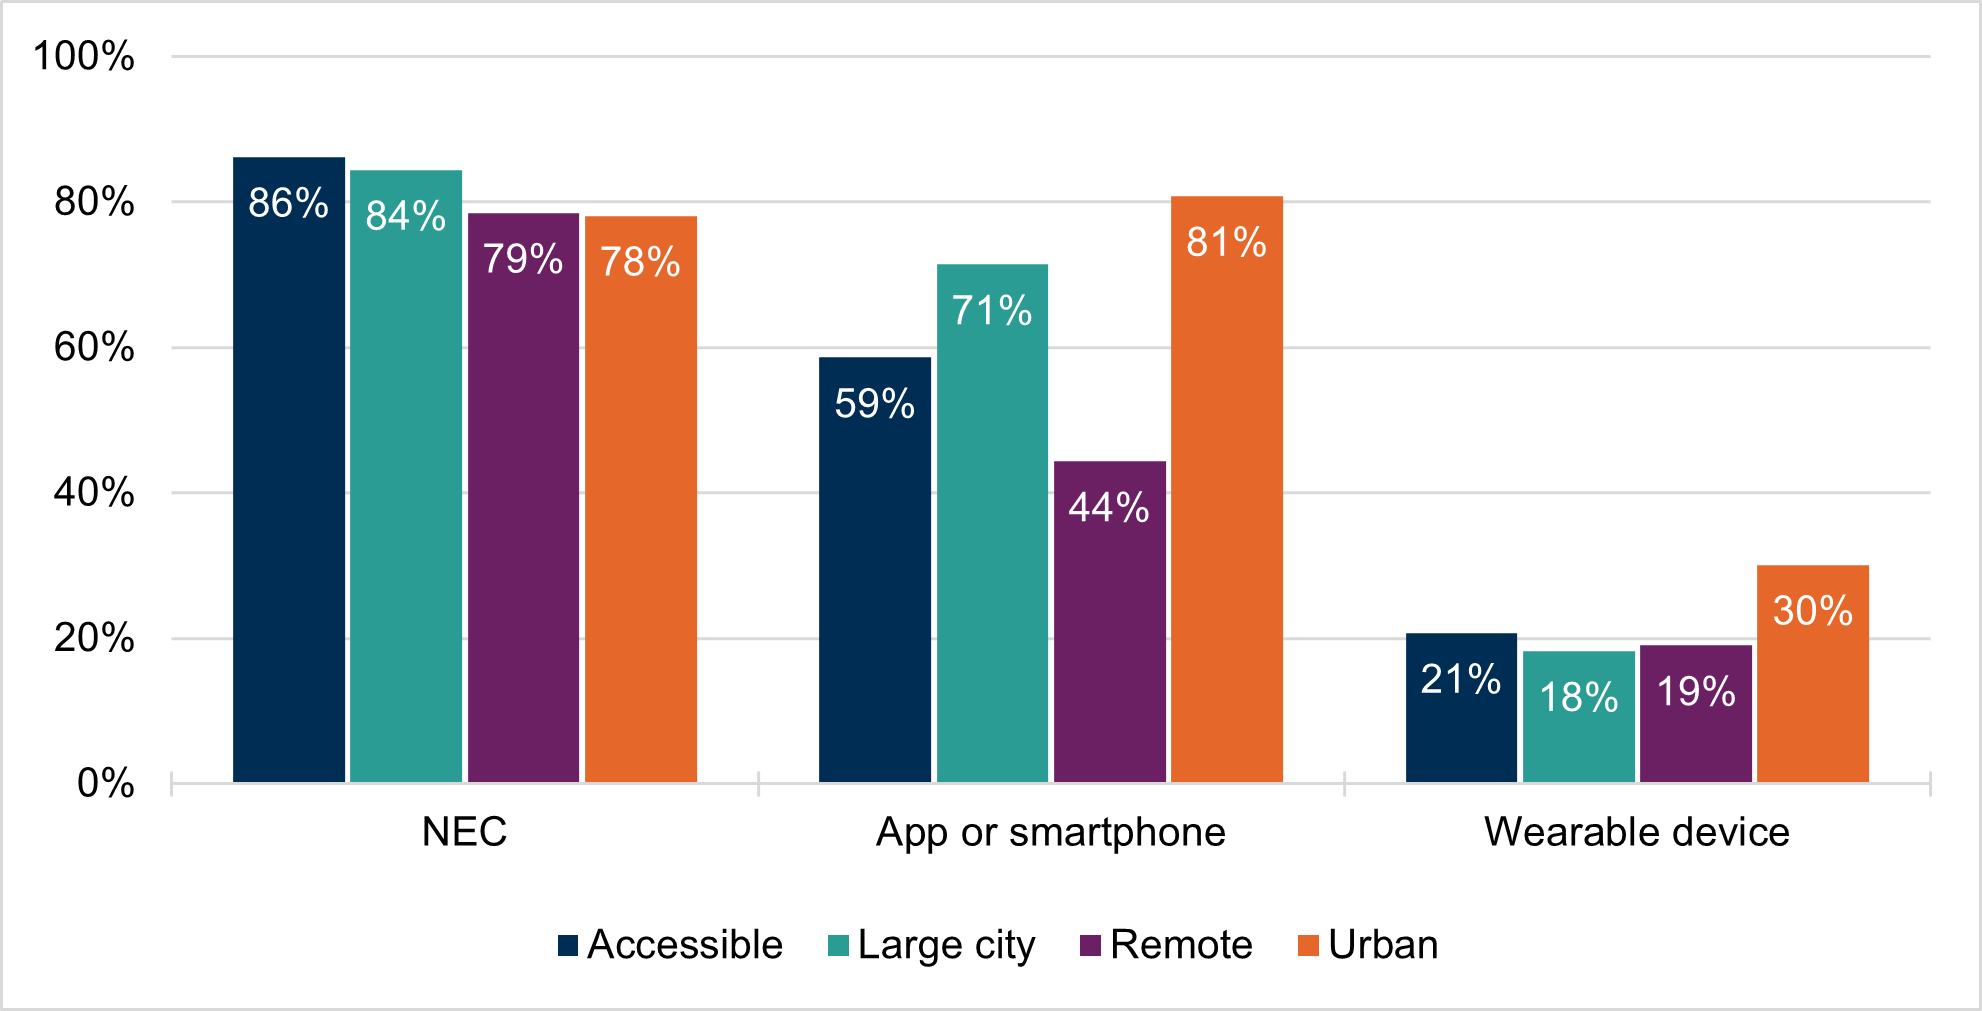
The legend is presented in the same order as the bars in the clusters.
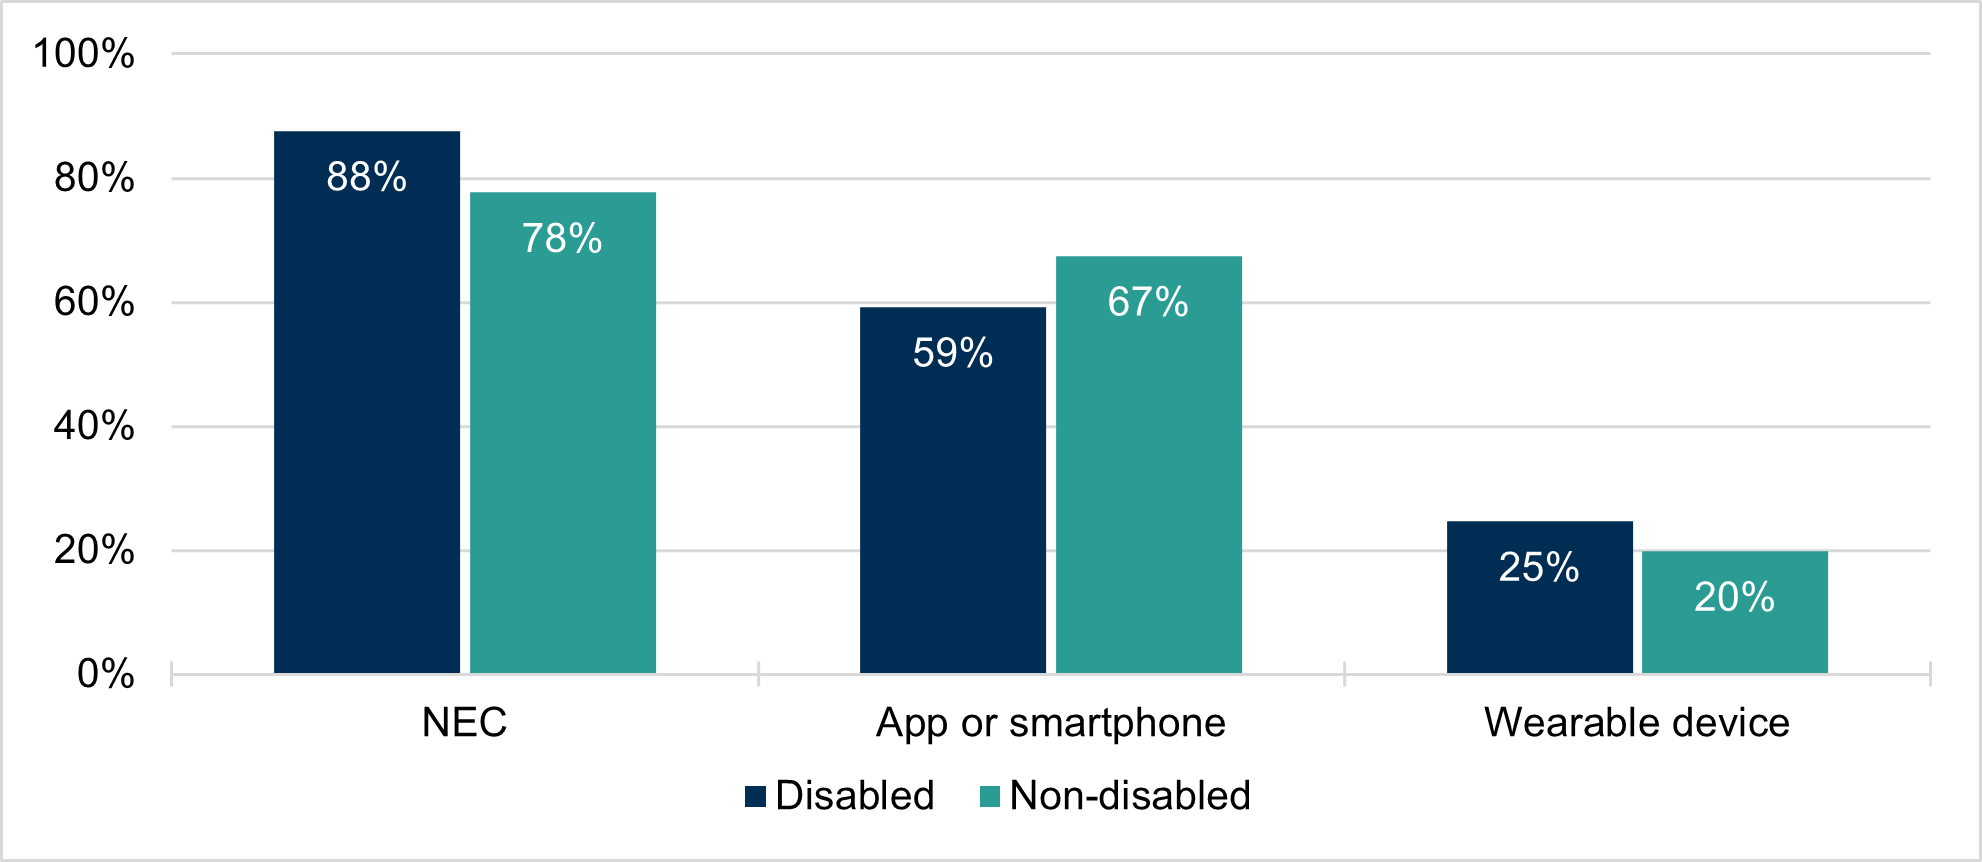
More disabled people would like to use their NEC and wearable technology than non-disabled people. 88% of disabled people would like to use the NEC, compared to 78% of non-disabled people. 25% of disabled people would use wearable technology to access the scheme, compared with 20% of non-disabled people. However, non-disabled people were more favourable towards using a smartphone for concessionary travel, with 67% in favour compared with 59% of disabled people. These results are shown in Chart 17.
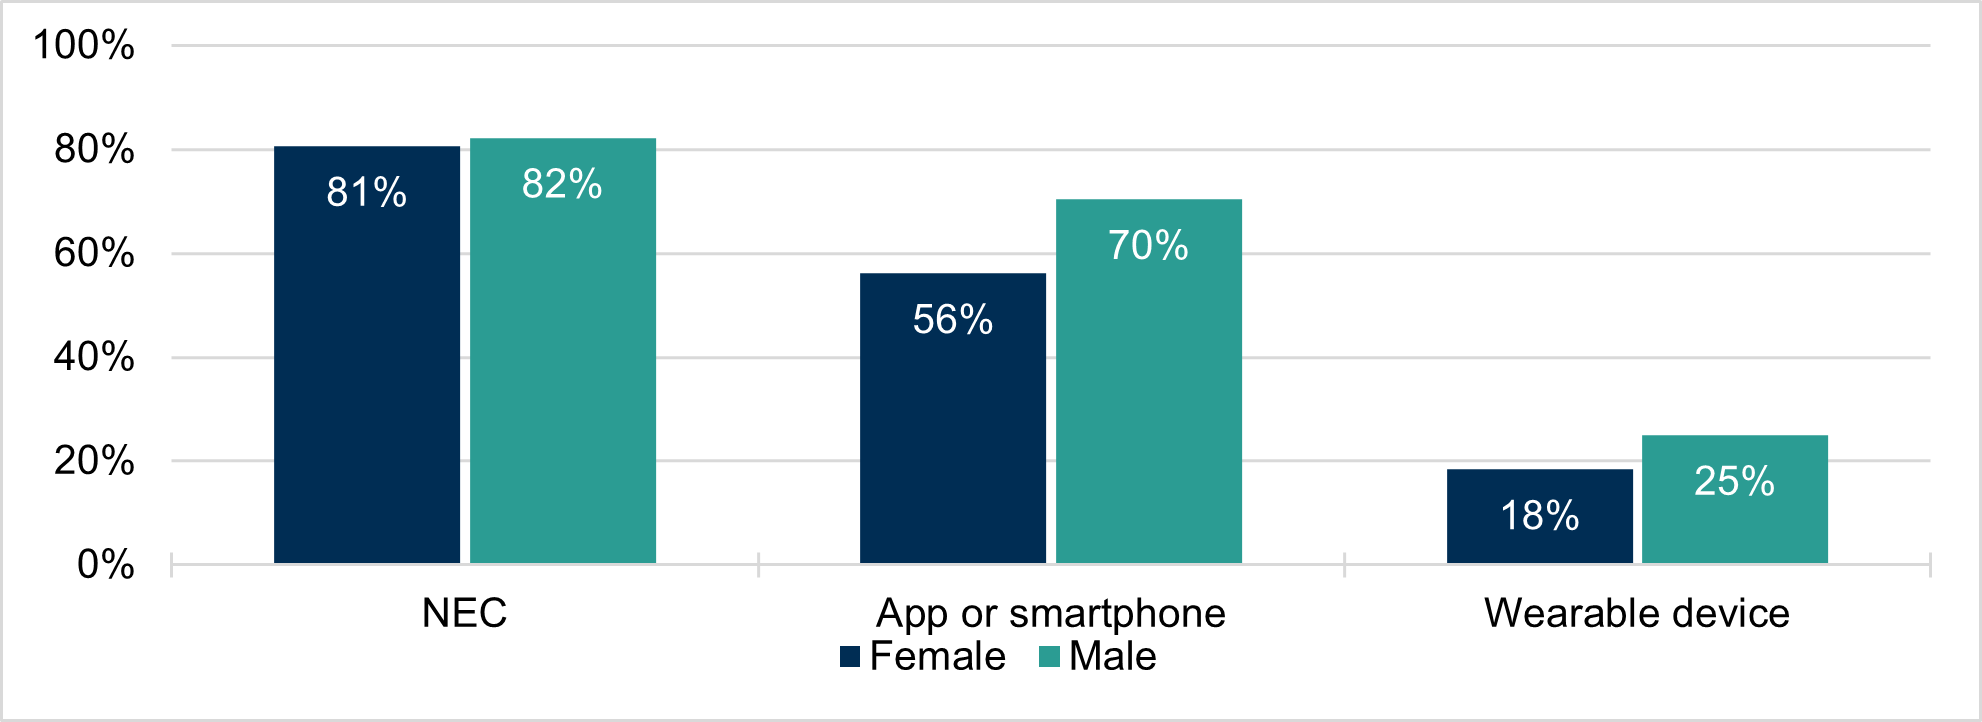
Men were more likely than women to have stated they would like to use the three technologies in future, as shown in Chart 18.
The legend is presented in the same order as the bars in the clusters.
When asked for additional comments about integrated and smart ticketing, one respondent praised the concessionary travel ticketing system in Sydney:
I would encourage you to consider the Opal system in use in Sydney by which people with concessionary discounts are given a pre-pay concession Opal card which is automatically topped up via e.g. direct debit when it runs low.”
This was the only example given of concessionary travel schemes in other places. However, it is worth noting that the National Concessionary Travel Scheme in Scotland provides free travel for users on bus, as opposed to a discount, therefore, differs from the operation of the example referred to above which just provides a discount.
Future use of smart ticketing
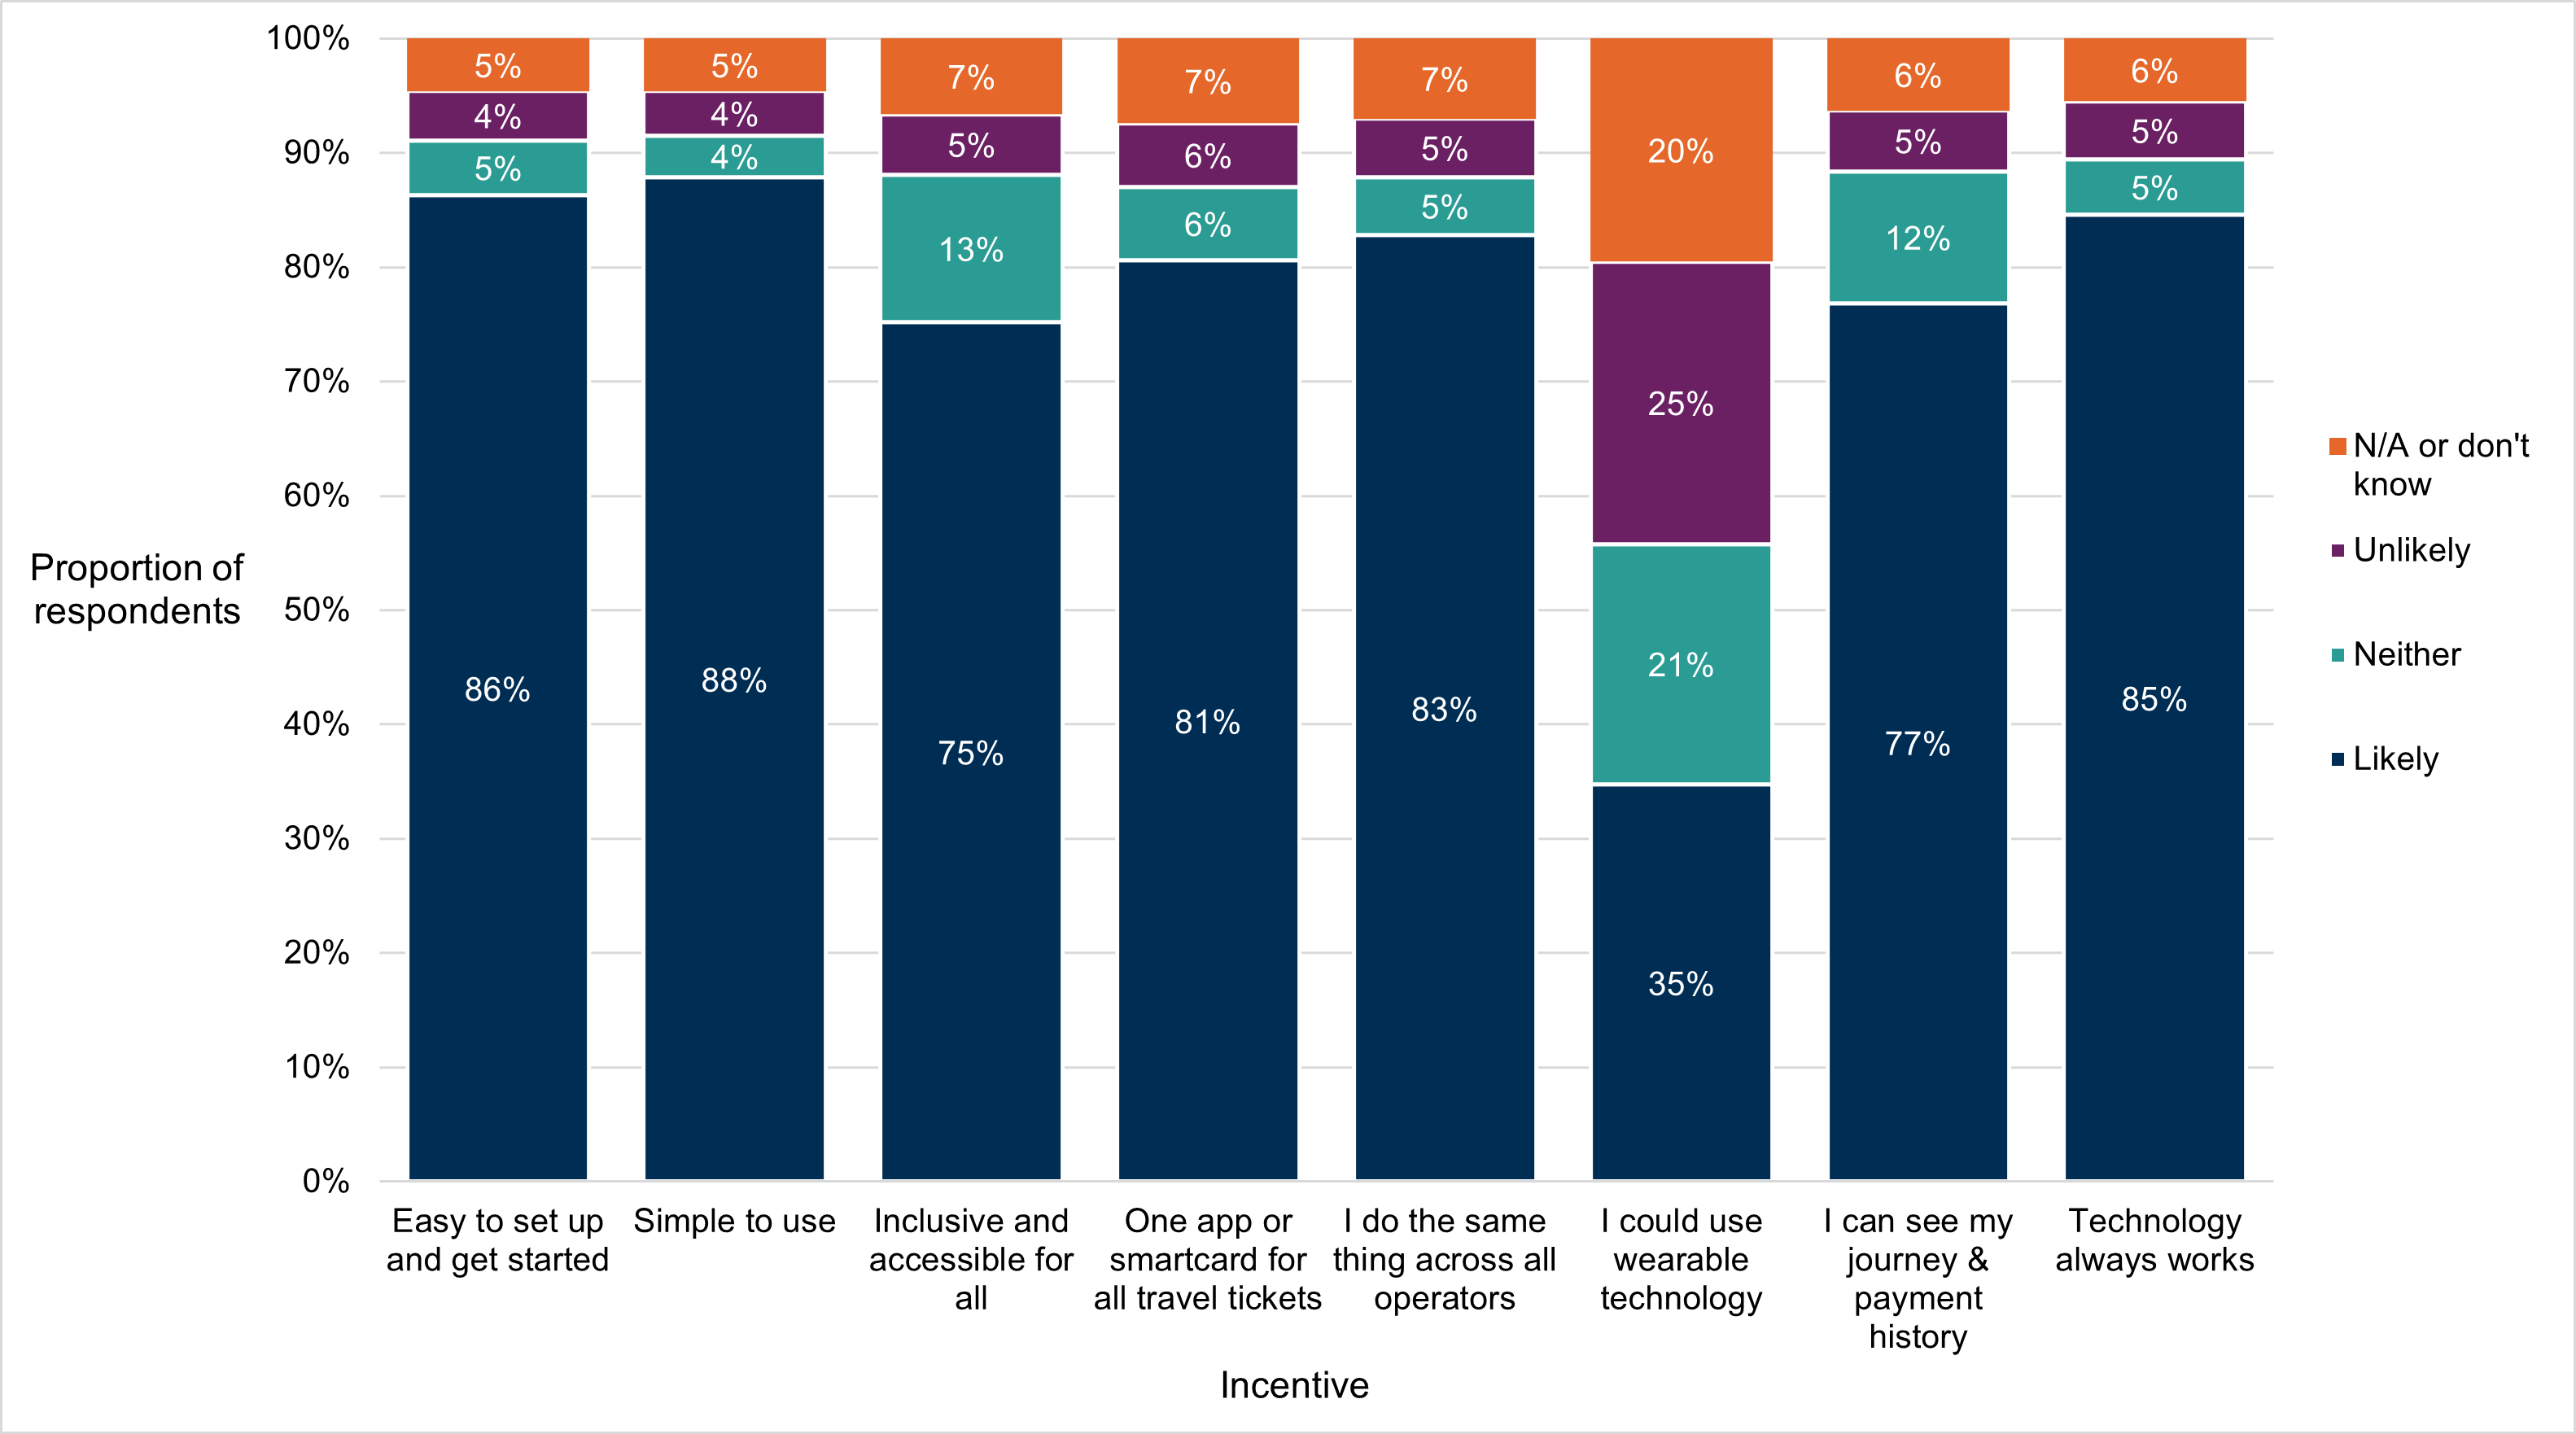
76% of respondents could be encouraged to use smart ticketing in future if more features were available.
Chart 19 shows that a large majority would like to use smart ticketing in future, given any of the proposed incentives. Ease of use was the most cited incentive to use smart tickets in future (88% in favour, 4% not). Just over a third (35%) said that the option of using wearable technology would encourage them to use smart ticketing, while 20% indicated that it would not. This data is also available in Annex Table 13.
The legend is presented in the same order as the categories within the bars.
As was the case for NCT users, interest in using wearable technology decreased with age, although around a quarter of 60+ respondents would still be incentivised by it. This is shown in Table 5.
| Age bracket | Would be incentivised by wearable technology | Would not be incentivised by wearable technology |
|---|---|---|
| 16-32 | 42% | 20% |
| 33-59 | 35% | 25% |
| 60+ | 24% | 29% |
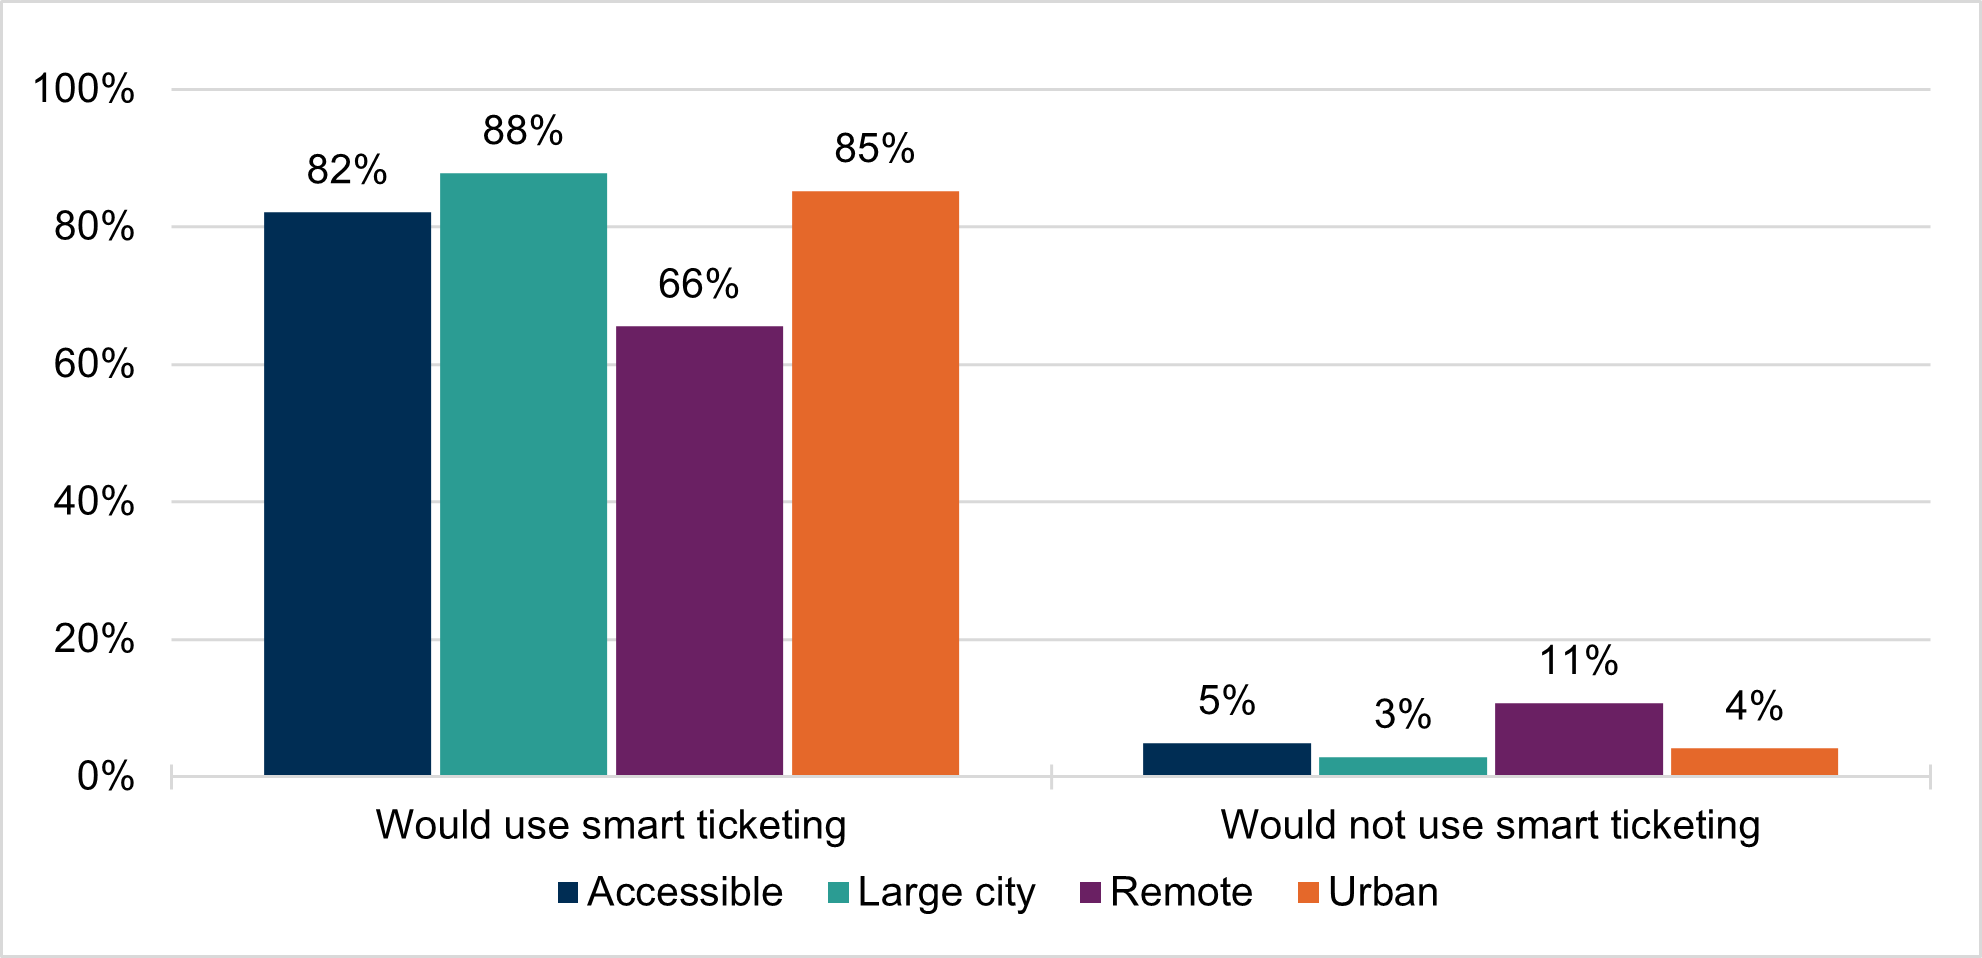
Chart 20 and Annex Table 14 show that a majority of people in all areas in Scotland would be use smart ticketing in the future, with the highest being in large city regions, and less in remote areas. This may reflect transport availability in the regions as well as digital connectivity and access.
Respondents were asked if there was anything else that would encourage them to use smart tickets. The majority of responses fell in line with the options already presented. Responses also echoed those provided to the question, “Is there anything else that would make you use an integrated ticket more?” (see page 19). The most common response concerned value for money and/or affordability as something that would encourage respondents to use smart ticketing more. This included standardised pricing across modes, capped fares per day, and smart ticketing providing better value for money than an alternative.
Smart ticketing needs to be the easiest way to get the cheapest price.”
A small number of respondents wanted to see integrated smart ticketing that extended across Scotland (and in one case into England), as this would allow them greater flexibility of travel. Many respondents referred to systems elsewhere (including London), stating that they would use smart ticketing more if it was integrated across modes and providers, and/or worked using contactless payments from their bank cards.
I worry that focus is being given to delivering smart ticketing platform which allows multiple tickets to be purchased across different operators and modes, when the real problem to be solved is in reducing the number of individual tickets which need to be purchased at all. Integrated ticketing, offering use of multiple modes across multiple operators with just one single ticket purchase, should be the goal.”
The model used on the Glasgow Subway is perfect (albeit could be even better if you can use bank card contactless payments at the gate I.e like TfL [Transport for London].)”
A small number of respondents stated that improved transport services more generally, including greater reliability and improved timetabling, would be an incentive for them to use smart ticketing.