Journey planning and Mobility as a Service
Journey planning
Chart 21 shows that most respondents found travel information in a number of places.
The majority – 82% – used transport operators’ apps or websites to find public transport travel information.
Over a quarter (27%) used Traveline Scotland. None of the 12% of respondents (121 people) who used paper timetables and maps relied on these as their only source of information, with most (105 people) also using transport operators apps or websites.
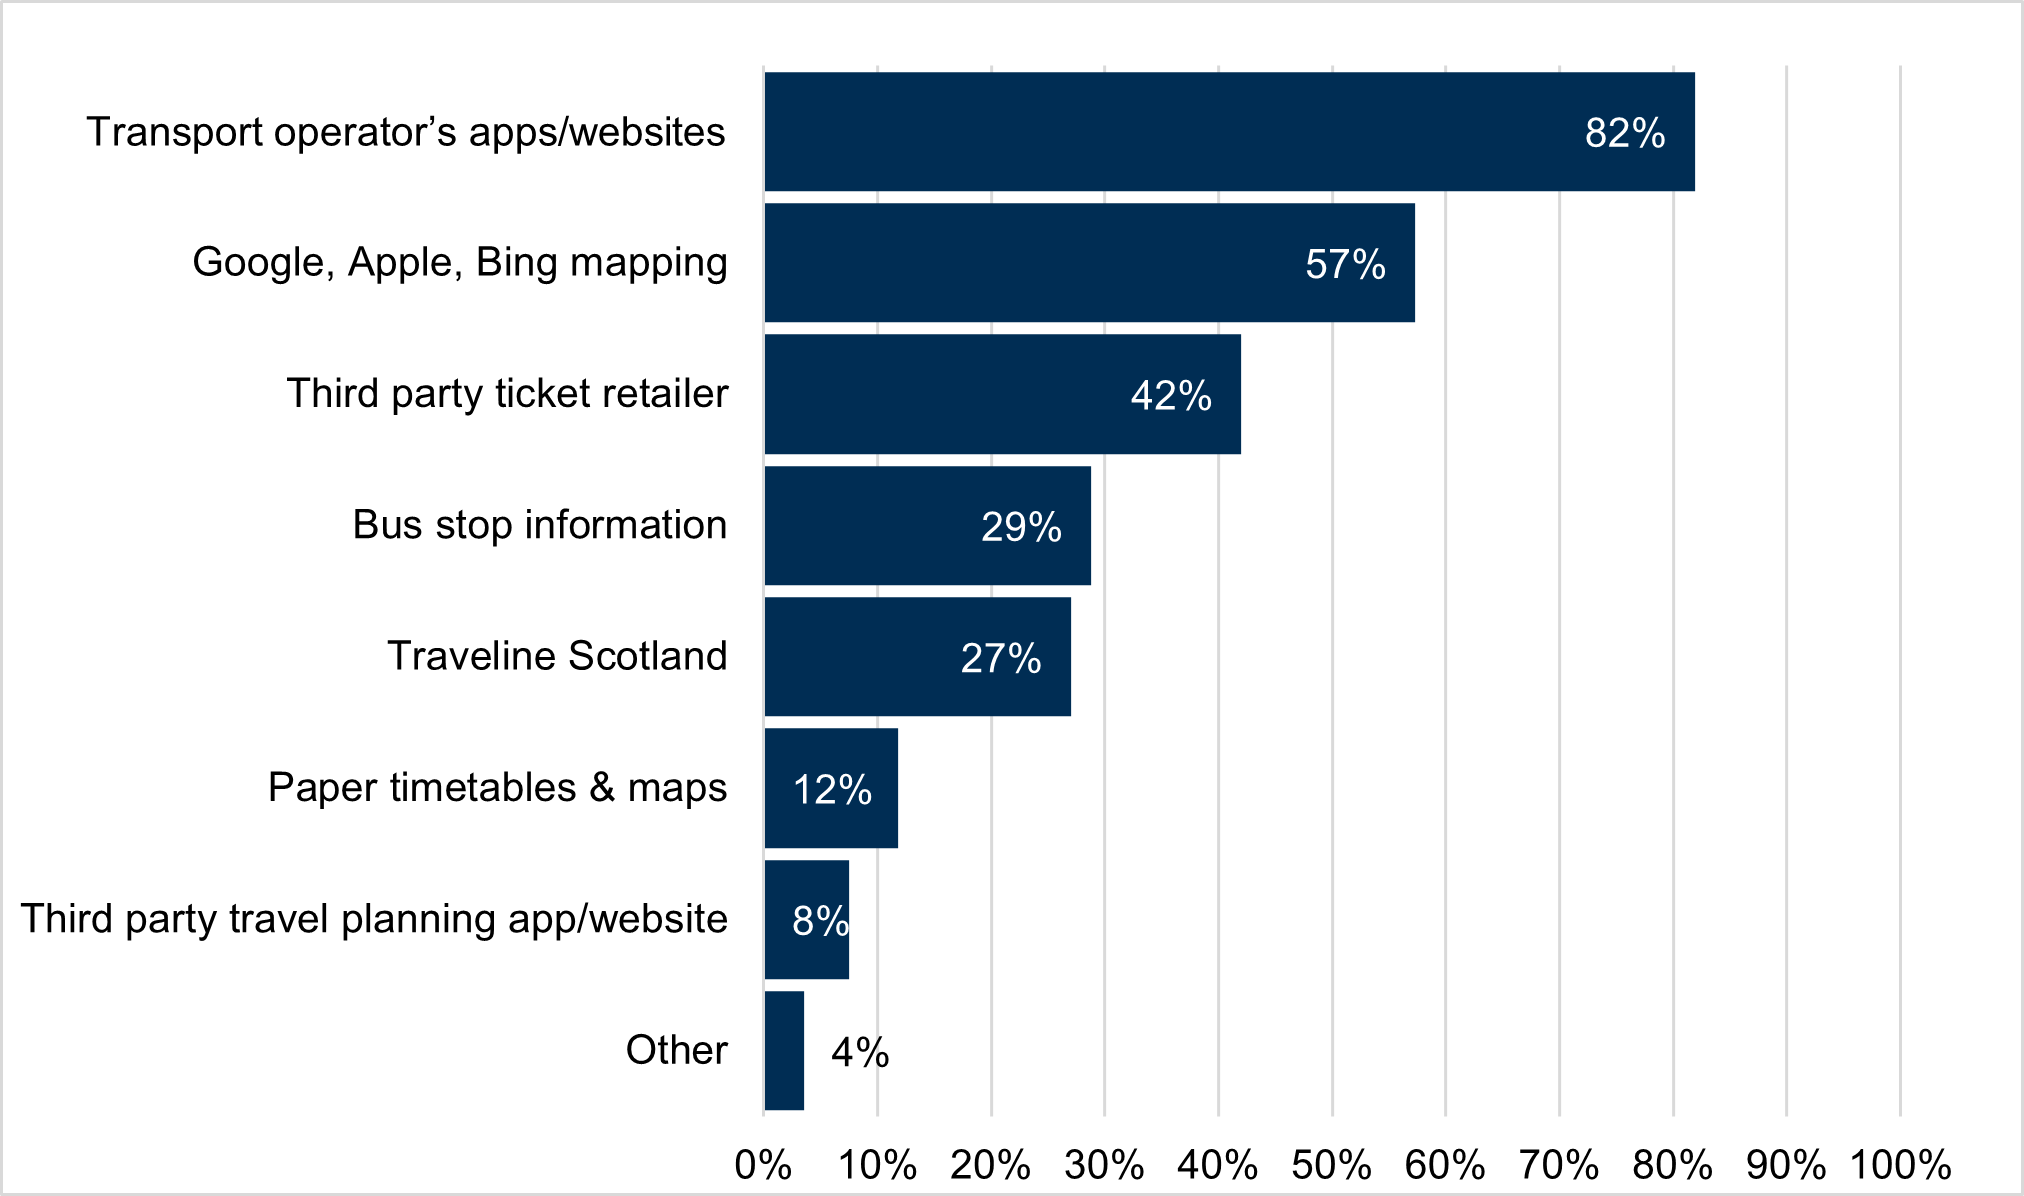
The data is also available in Annex Table 15.
People aged 60+ were more likely to use Traveline Scotland than bus stop information (38% for Traveline Scotland, 28% for bus stop information). Chart 22 and Annex Table 16 show that people in remote areas were more likely than people living elsewhere to use paper timetables and maps. People in large cities were more likely than others to use third party travel planning apps and Google/Apple/Bing maps.
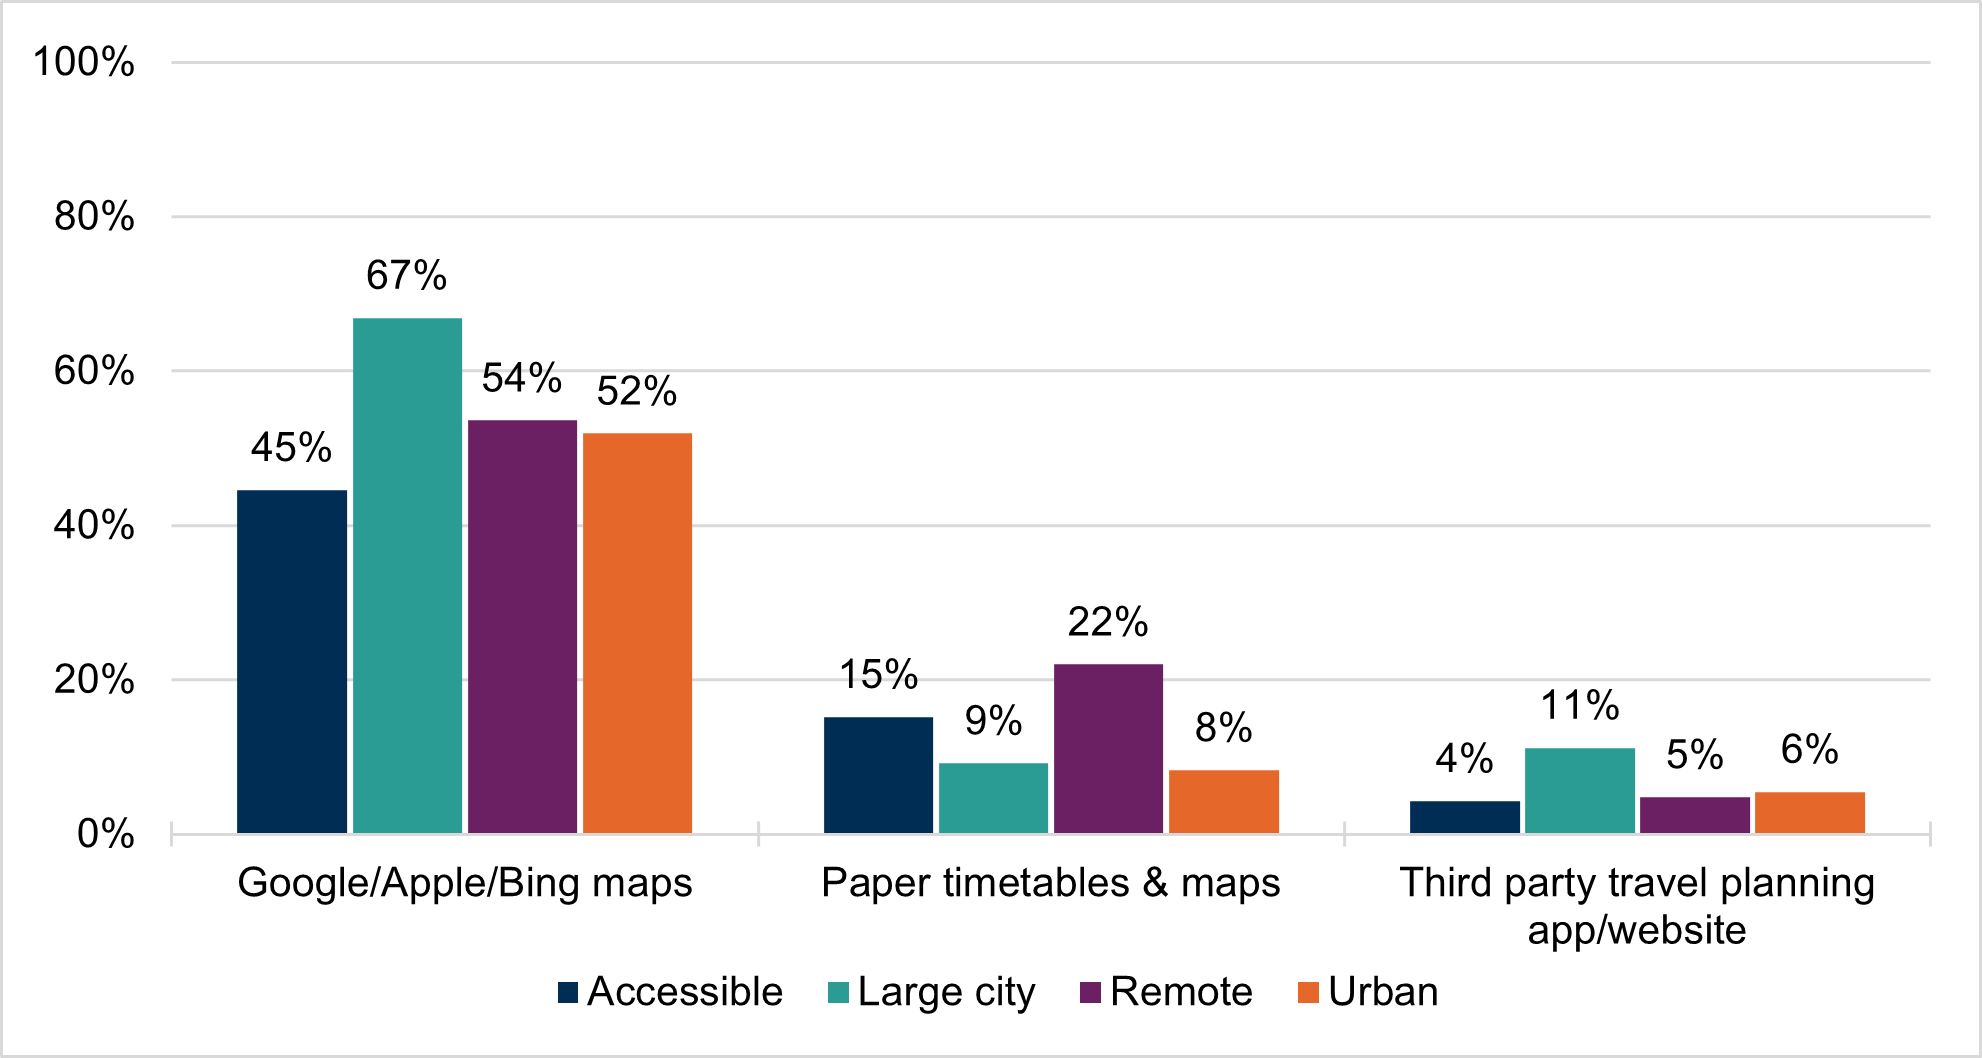
The legend is presented in the same order as the bars in the clusters.
Mobility as a Service
Mobility as a Service features in the Scottish Government National Transport Strategy Delivery Plan (2022-2023) (NTS2) as one way to increase use and availability of low carbon technologies and approaches to transport. The MaaS pilots supported by the Scottish Government
“offer innovative digital data-driven solutions that provide people with better information, and easier access to sustainable transport options, in order to make public transport travel a viable alternative to the car. i.e., providing a ‘one-stop-shop’ for multimodal journey planning and tickets.” (NTS2, p.20)
The pilots are briefly described on Transport Scotland’s website. Of all respondents, 11% had heard of the Mobility as a Service pilots.
Journey planning apps and websites
Timetables, fares and availability, real-time information, and live disruption alerts were the most popular of the proposed features of a journey-planning app or website.
98% of respondents agreed that it would be useful for journey-planning apps or websites to show real-time information and live disruption alerts.
A very small minority (0.4 to 0.5%) stated that these features would not be useful. The least popular feature, with only 33% agreeing it would be useful and 35% stating it would be not be useful, was the ability to book non-travel elements of a journey, such as hotels or activities. The most popular response for each suggested feature is highlighted in Table 6.
| Proposed feature | Very useful | Somewhat useful | Neither | Not very useful | Not at all useful | Don't know |
|---|---|---|---|---|---|---|
| Assistance with journey planning | 47% | 35% | 11% | 3% | 2% | 3% |
| Timetables of services | 80% | 17% | 2% | 0% | 0% | 1% |
| Checks fares and availability | 81% | 16% | 1% | 0% | 1% | 1% |
| Realtime information | 86% | 12% | 1% | 0% | 0% | 2% |
| Live disruption alerts | 84% | 14% | 1% | 0% | 0% | 1% |
| Suggested alternative routes when disrupted | 69% | 26% | 3% | 1% | 1% | 1% |
| Ability to book & purchase tickets | 75% | 18% | 4% | 1% | 1% | 2% |
| A place where all your tickets & payments are in one place | 75% | 15% | 6% | 1% | 2% | 1% |
| Accessible travel information | 50% | 23% | 17% | 3% | 2% | 5% |
| Personalised travel information | 43% | 30% | 18% | 3% | 3% | 4% |
| Travel incentives & rewards | 46% | 25% | 19% | 4% | 4% | 3% |
| Information about emissions of different journey options | 20% | 26% | 26% | 9% | 13% | 5% |
| Ability to book/pay for types of transport other than bus, train and ferry: e.g. Demand Responsive Transport, car share, cycle hire, taxis. | 35% | 25% | 18% | 8% | 6% | 8% |
| Ability to book non-travel elements of your journey e.g. hotels / activities. | 14% | 19% | 25% | 18% | 17% | 7% |
| Active & leisure travel routes (i.e. walking & cycling) | 29% | 31% | 18% | 7% | 9% | 6% |
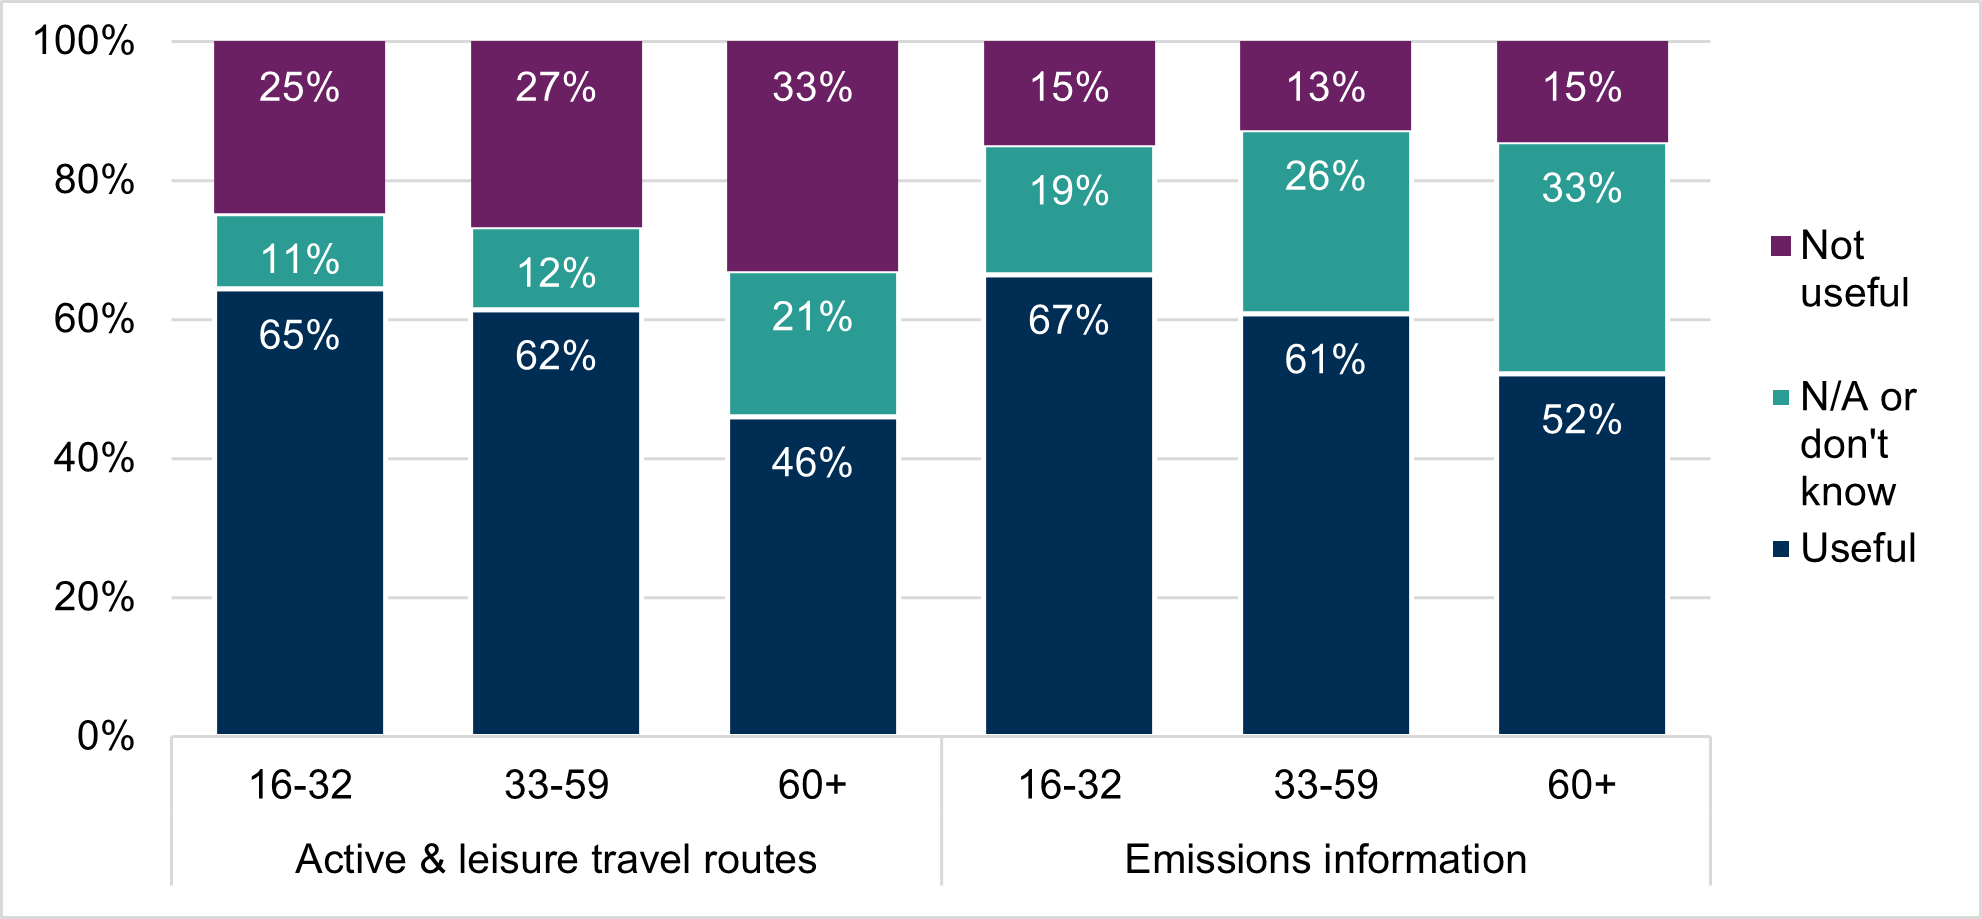
Chart 23 shows that interest in information about active and leisure travel routes, and emissions decreased with age. There is more detail about this data in Annex Tables 17 and 18.
Respondents were asked if there was anything else that would encourage them to use a journey planning app or website. Most responses were an extension of or variation on the features previously suggested, e.g.
One stop shop for all not just the able.”
Seven respondents said that the app or website should contain information for cyclists, e.g. hazards on cycle routes, and information about space for bikes on trains. Four respondents said that an app which allowed users to link public transport with active travel would be welcome.
Sometimes planning apps find me a route that involves multiple changes. In many cases I'd rather walk a bit further and have fewer changes…An app that could prioritise walking preferences would be a game changer.”
Seven respondents said that an app should have network maps, including downloadable maps, with three others saying that information on the app should be accessible offline.