Introduction
Survey purpose
Transport Scotland is refreshing its 2018 Smart Delivery Strategy. For this, Transport Scotland is establishing what projects and programmes it should focus on over the next 5-10 years. Some potential projects are a continuation of existing projects, or part of the Programme for Government or the Transport (Scotland) Act 2019.
This survey addressed three themes to understand opportunities to enhance smart and integrated ticketing:
- Integrated Ticketing: What is most important to people in relation to integrated ticketing?
- Smart ticketing: Contactless, mobile payments and smartcards are all available, but what do people like using for different modes, and for concessionary travel? In addition, are people interested in Account Based Ticketing?
- Journey Planning: How can we enhance Traveline Scotland to support the way people plan journeys and buy tickets? Are people aware of Transport Scotland’s Mobility as a Service pilots?
Methodology
This online survey ran from 30th March 2023 to 14th May 2023. It was distributed through social media, and shared further by local news websites, community councils, schools and transport operators. Scottish Government staff were also invited to participate in the survey.
Transport Scotland engaged with transport operators during the survey’s development to ensure it met their needs as well as Transport Scotland’s.
In this report, percentages are usually rounded to the nearest whole number for readability. Some questions allowed selection of multiple answers, therefore the sum of the percentages do not always equal 100%. A copy of the survey is available in Annex 1.
Respondent profile
1,029 people responded to the survey. 1,011 (98%) respondents had used public transport in Scotland in the 12 months prior. One-quarter of respondents (259) were users of national concessionary travel schemes in Scotland.
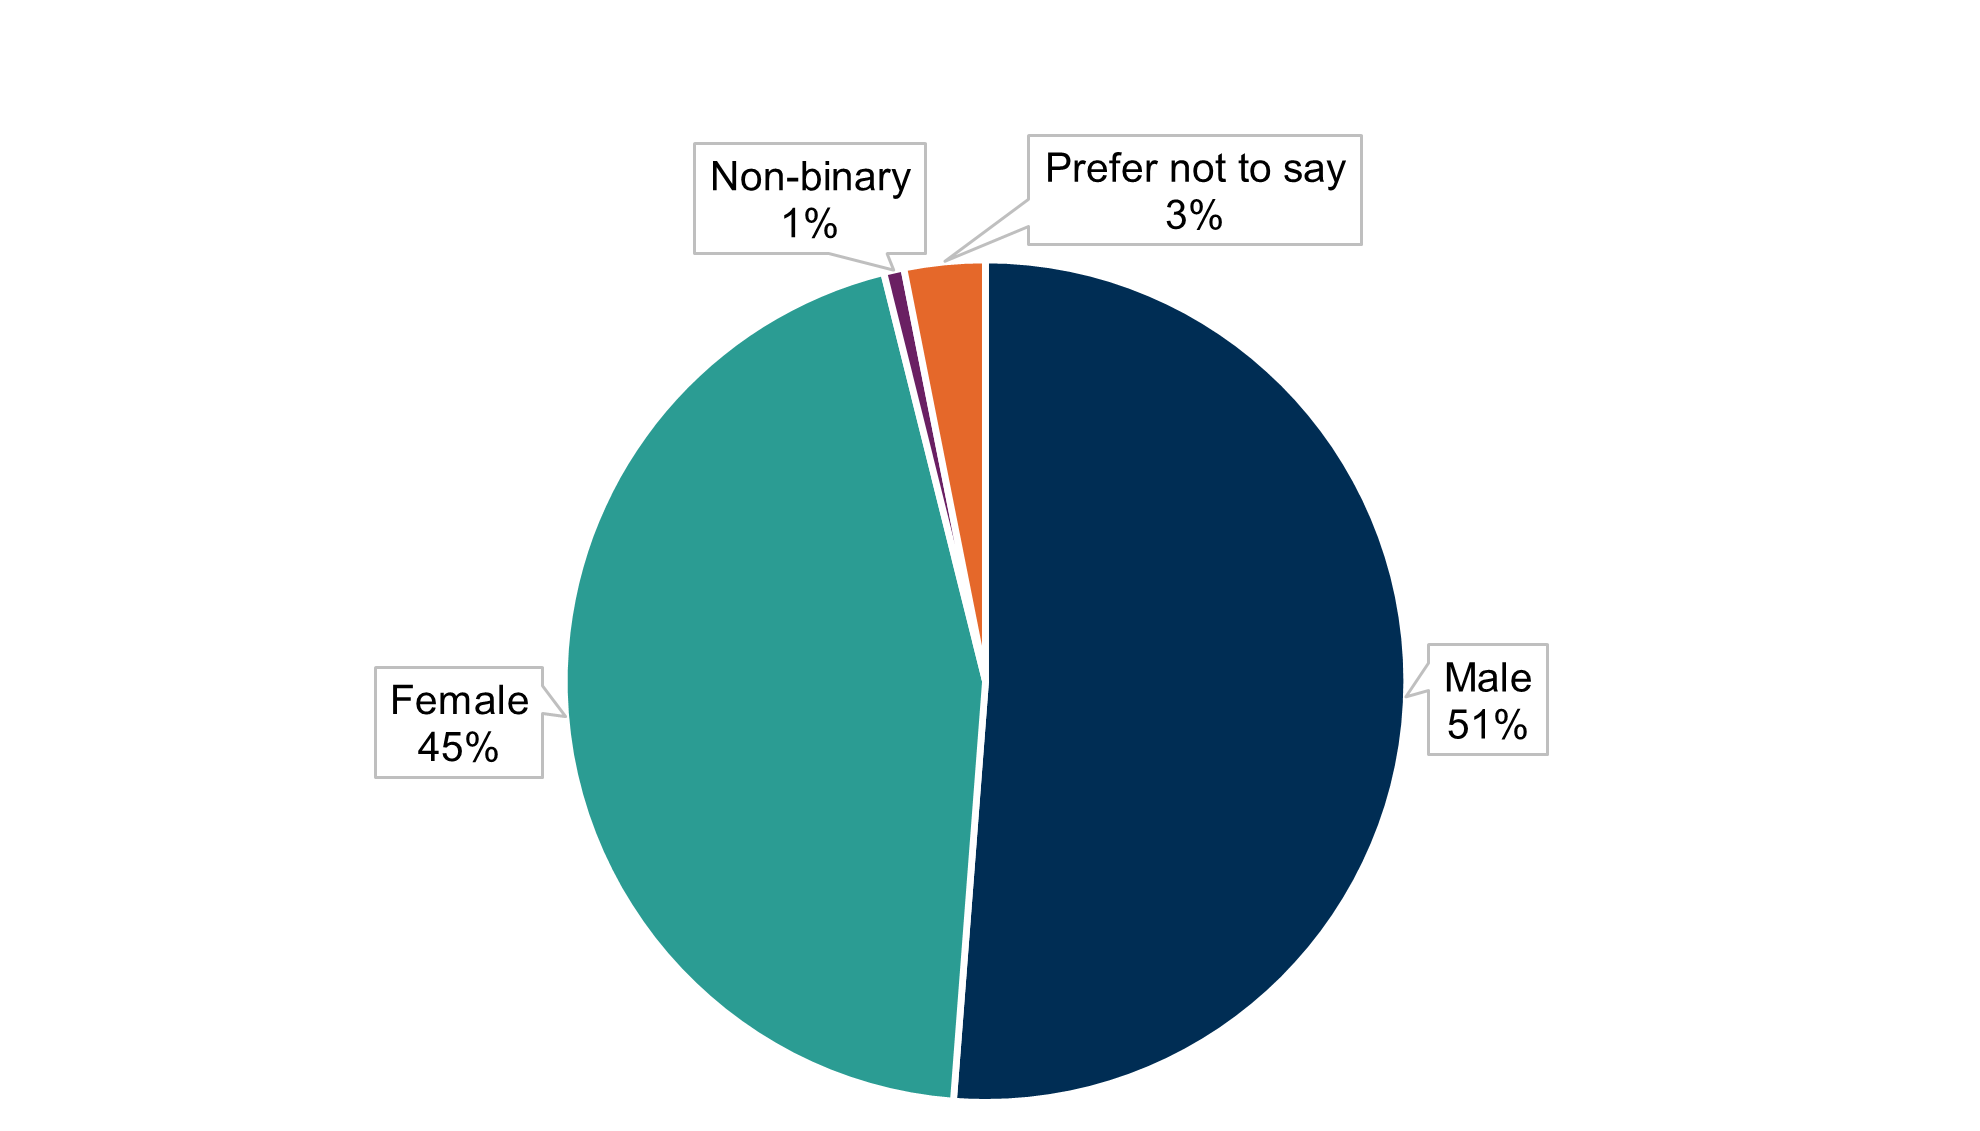
Respondents were recruited through social media (28%); transport operator’s own email or social media (16%); and through word of mouth, local press and local authorities (19%). Scottish Government staff were also invited to participate. Just over half of respondents (51%) identified as male, 45% as female, and 1% as non-binary. This is shown in Chart 1.
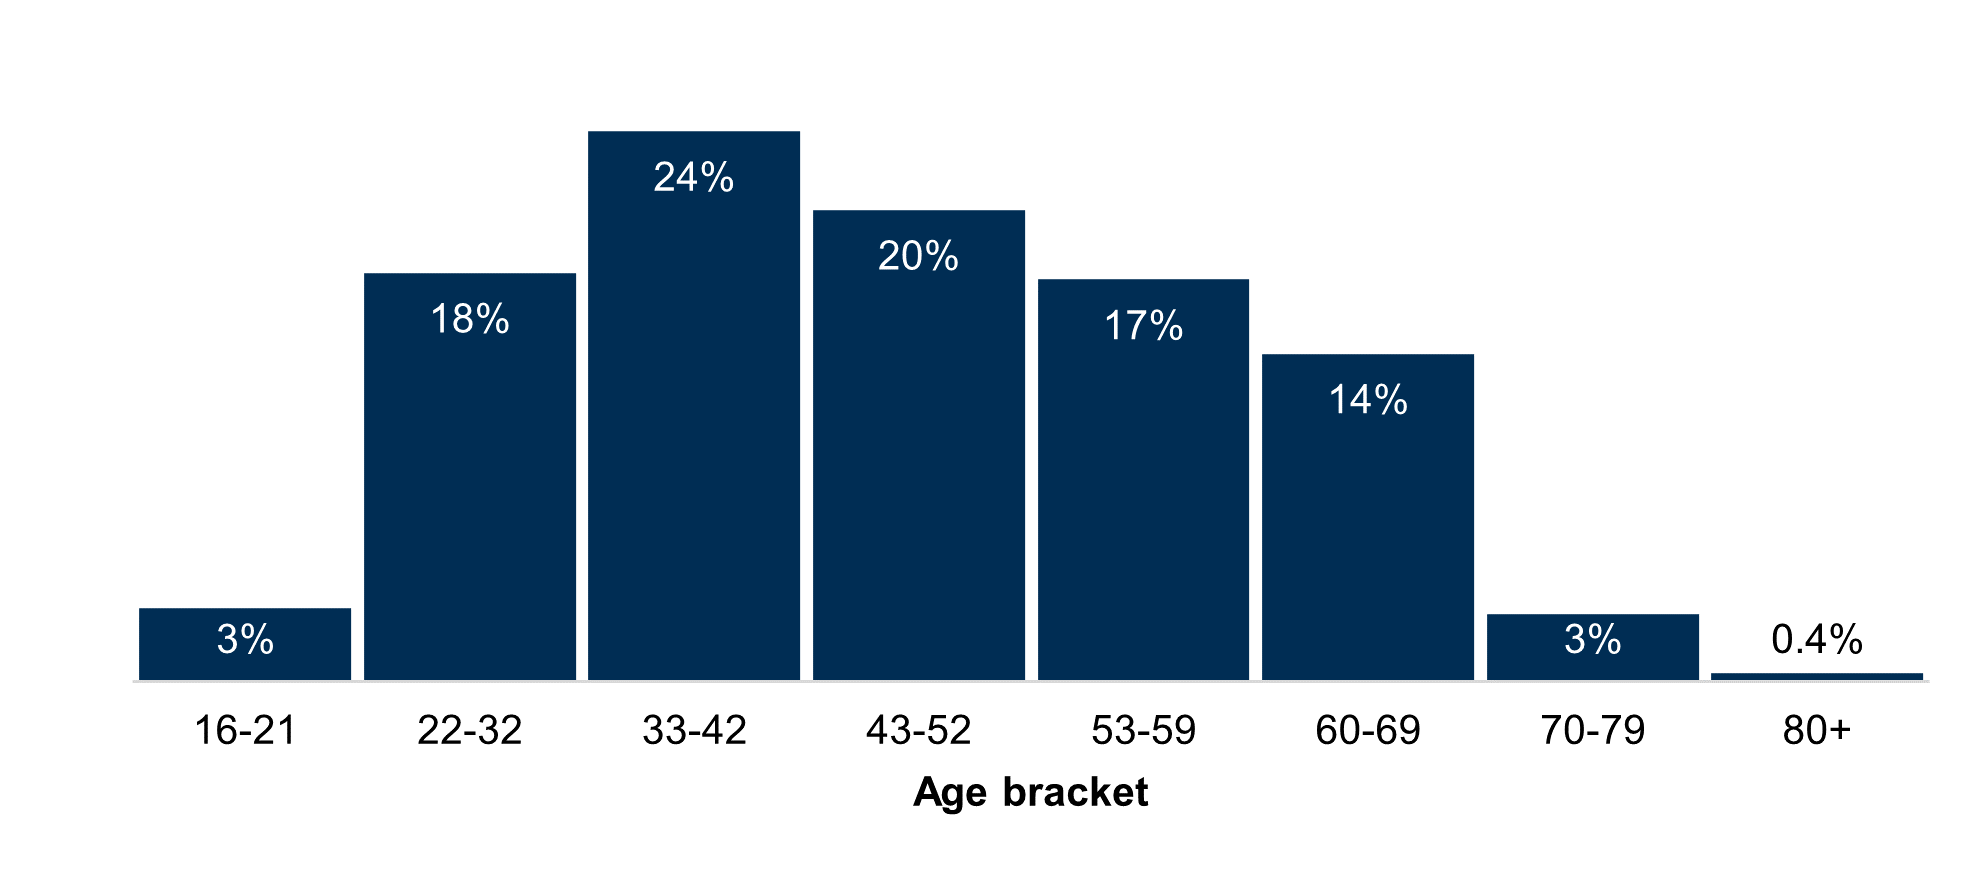
The largest proportion of respondents (24%) were aged 33-42, as shown in Chart 2.
Around one in 10 (11%) respondents reported having a physical health condition, with 6% reporting a mental health condition. A small number (2%) reported having both types of condition.
Responses were received from people in all 32 local authorities, as well as 14 responses from people outside Scotland. The largest proportion (35%) were based in Glasgow or Edinburgh. Information on geographical distribution of respondents is shown in Chart 3.
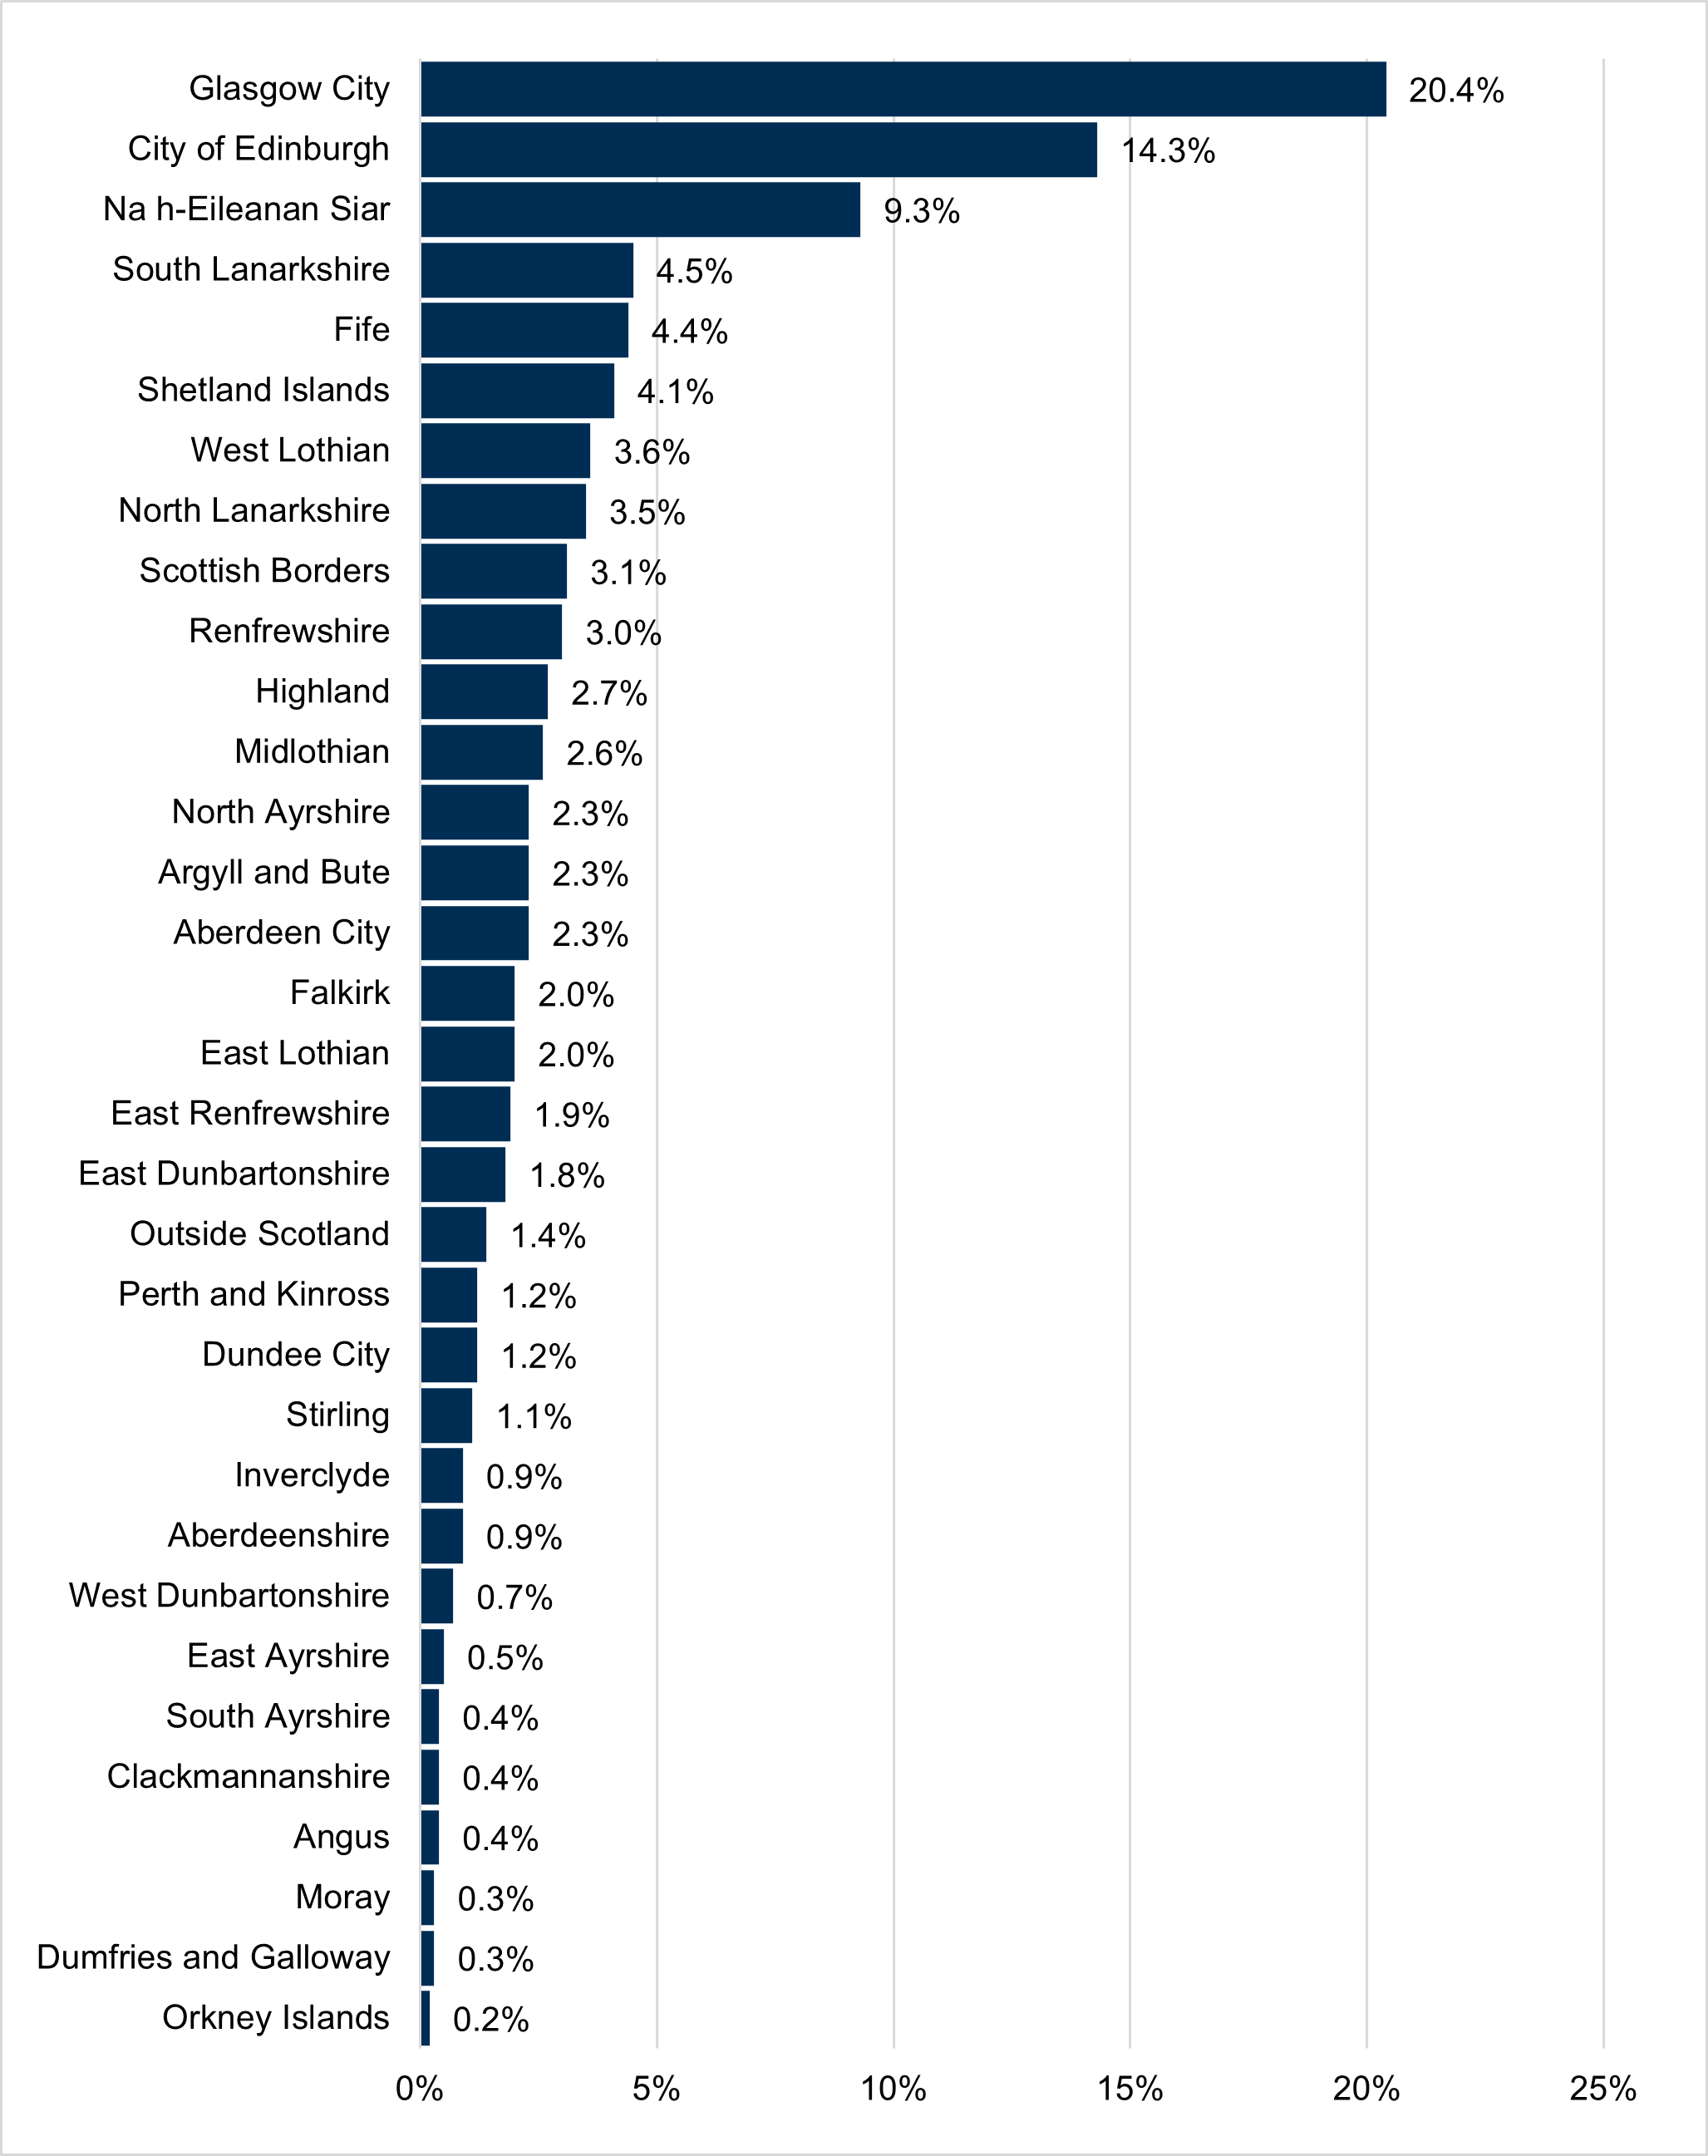
The data are also available in Annex Table 2.
In line with this, 65% stated that they usually travelled in the Greater Glasgow area, with 56% usually travelling in Edinburgh and the Lothians; and 19% usually travelling in the Highlands. There is more detail about respondents’ areas of travel in Chart 4 which shows that the majority of respondents usually travelled in Greater Glasgow, and Edinburgh & Lothians. 65% of respondents usually travelled in the Greater Glasgow area. 55.8% travelled in Edinburgh and the Lothians.
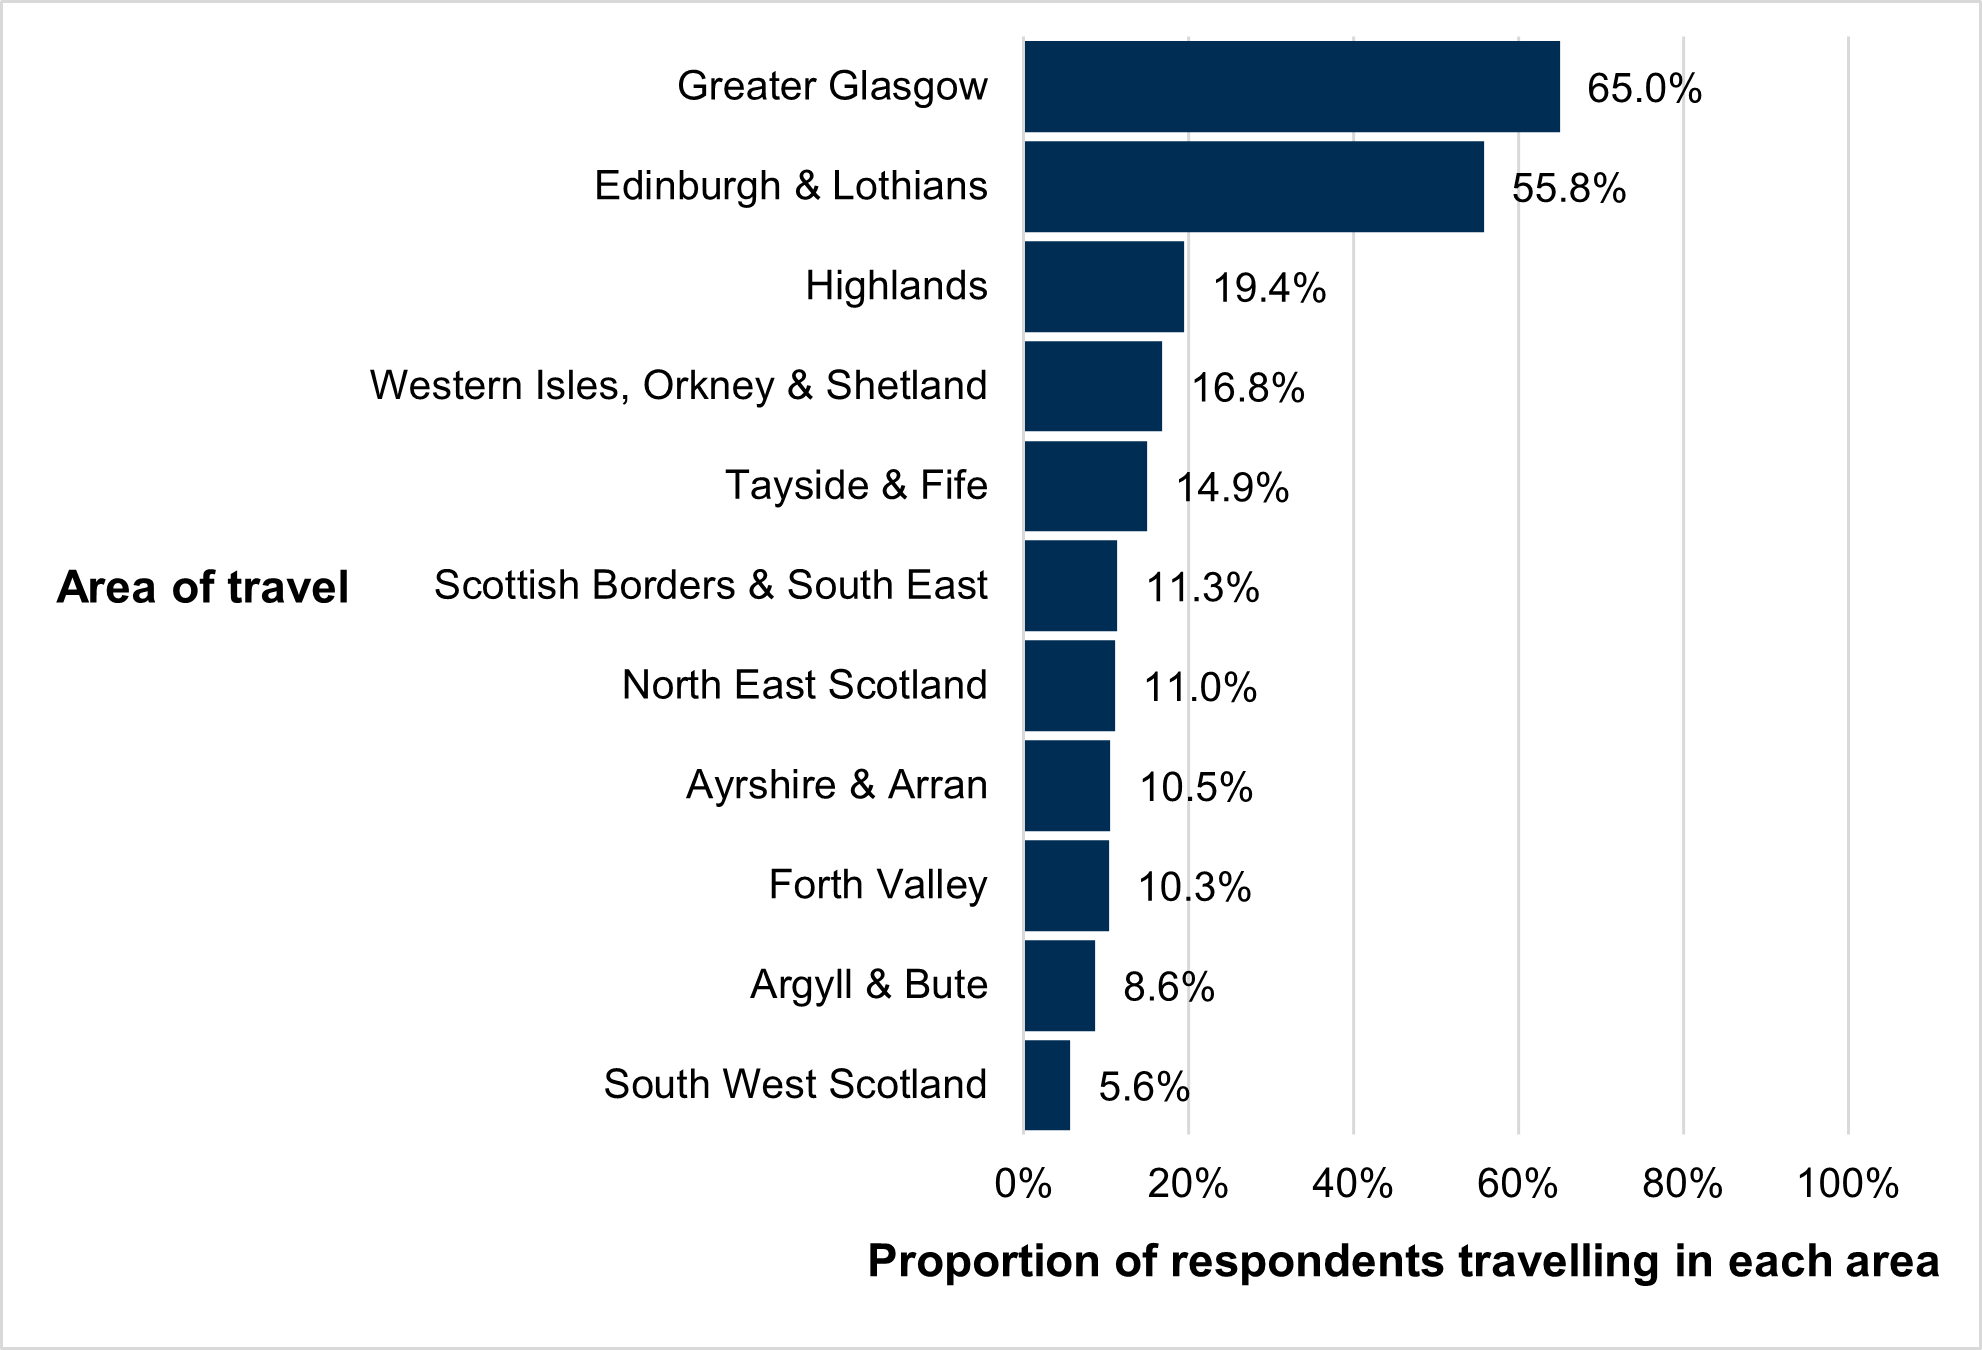
The data are also available in Annex Table 3.
Access to payment technologies
Respondents were asked if they had access to any of three technologies that could be used for smart ticketing: 93% had smartphone access; 91% had access to contactless payments; and 90% could make online payments.
Access to these technologies varied by age and location, and to a lesser extent by disability status and gender. Chart 5 shows that, as may be expected, a higher proportion of those aged 16-32 could access these technologies than those aged 60+. Access to the technologies exceeds 80% for all age brackets, although it decreases with age.
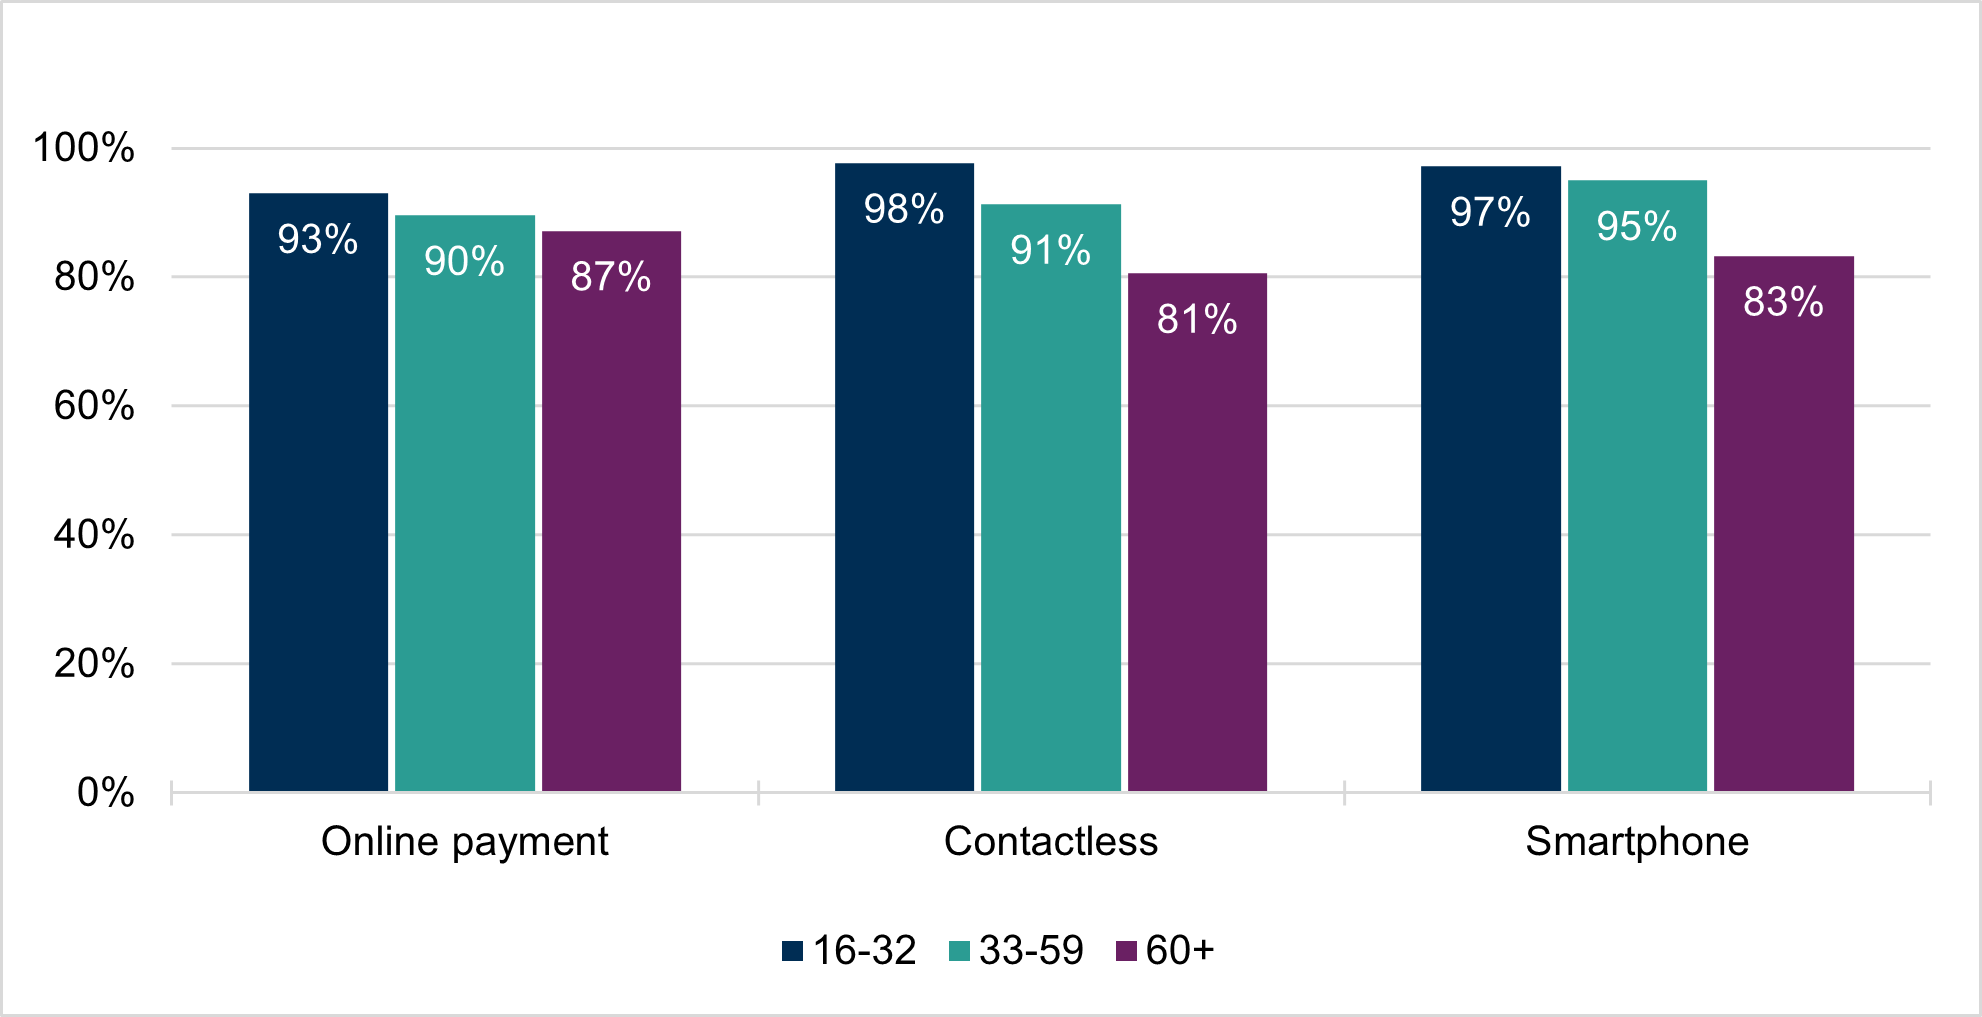
The legend is presented in the same order as the bars in the clusters.
Chart 6 shows that access was highest among those in large cities, and lowest among those in remote areas.
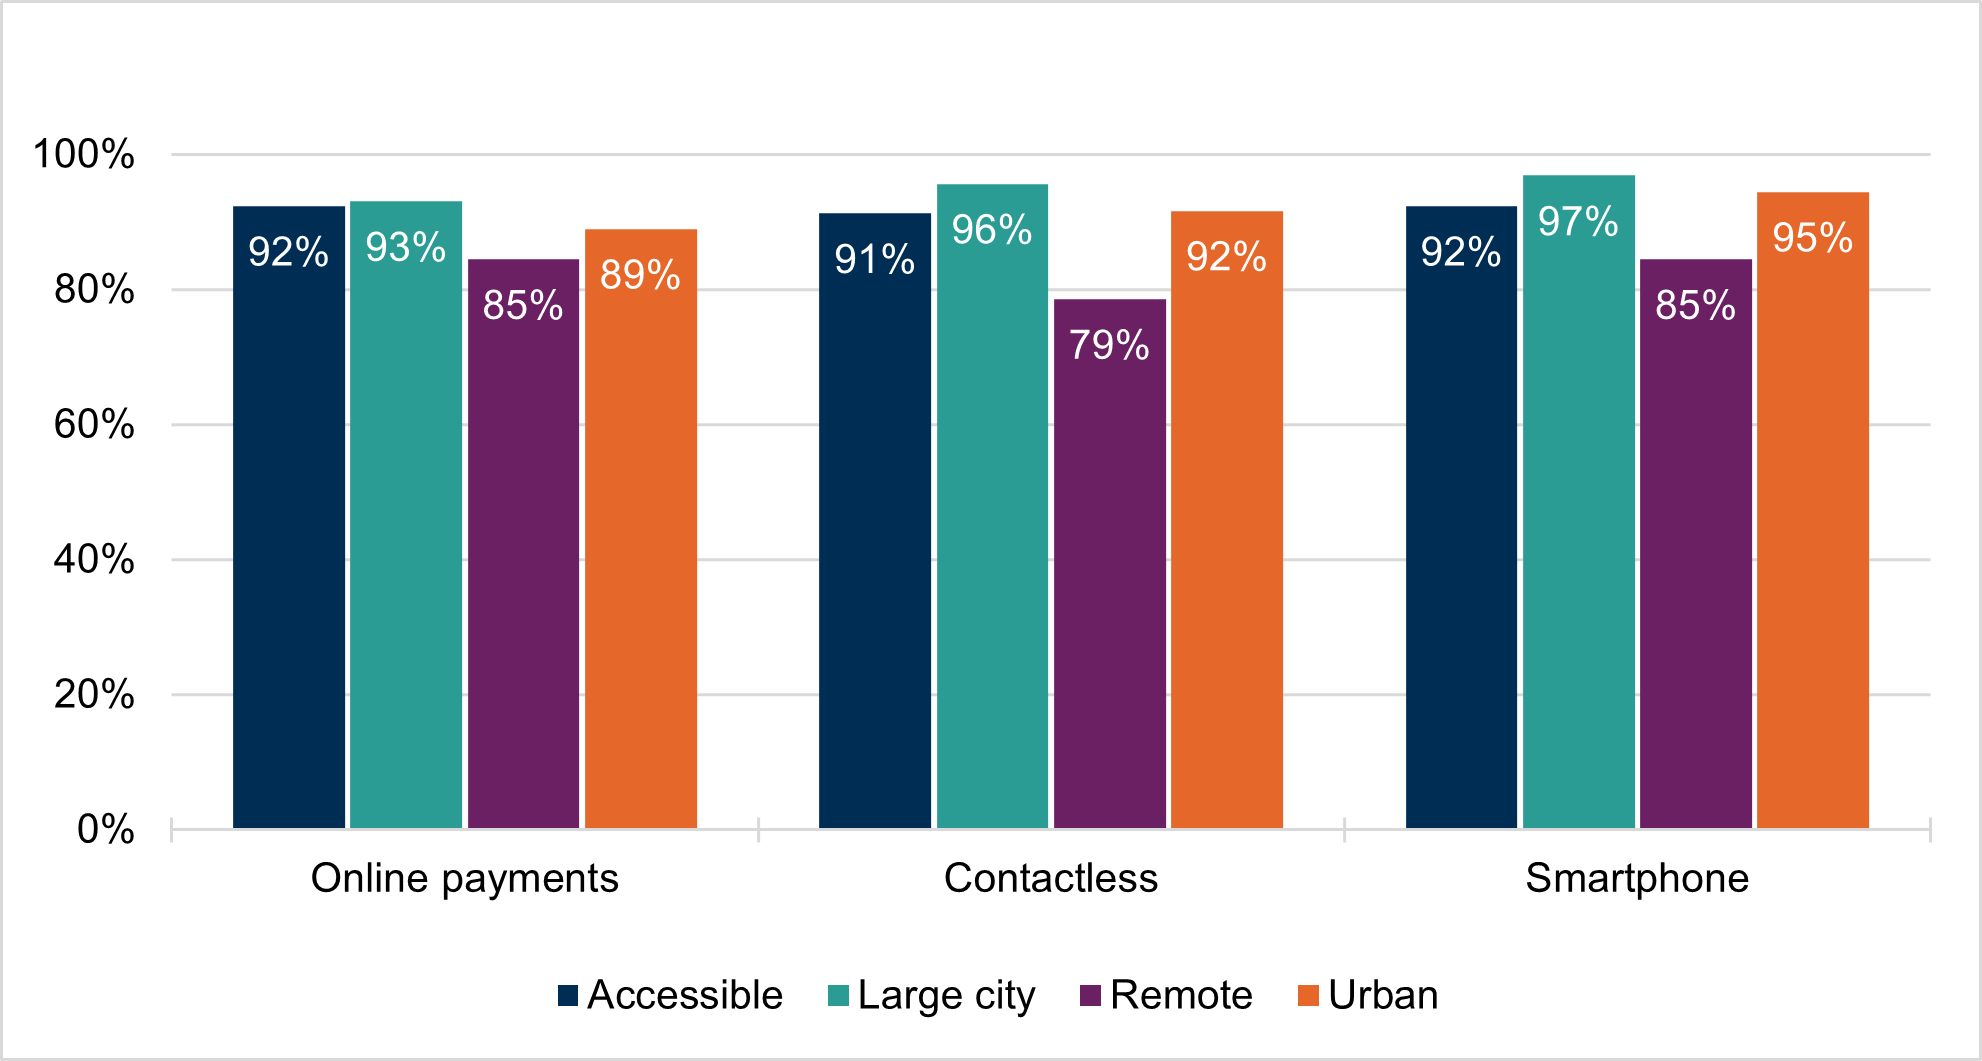
Chart 7 shows that non-disabled people had greater access to smart ticketing technologies than disabled people, especially to smartphones. The information in charts 5, 6 and 7, and the data for gender differences, is also available in Annex Table 4.
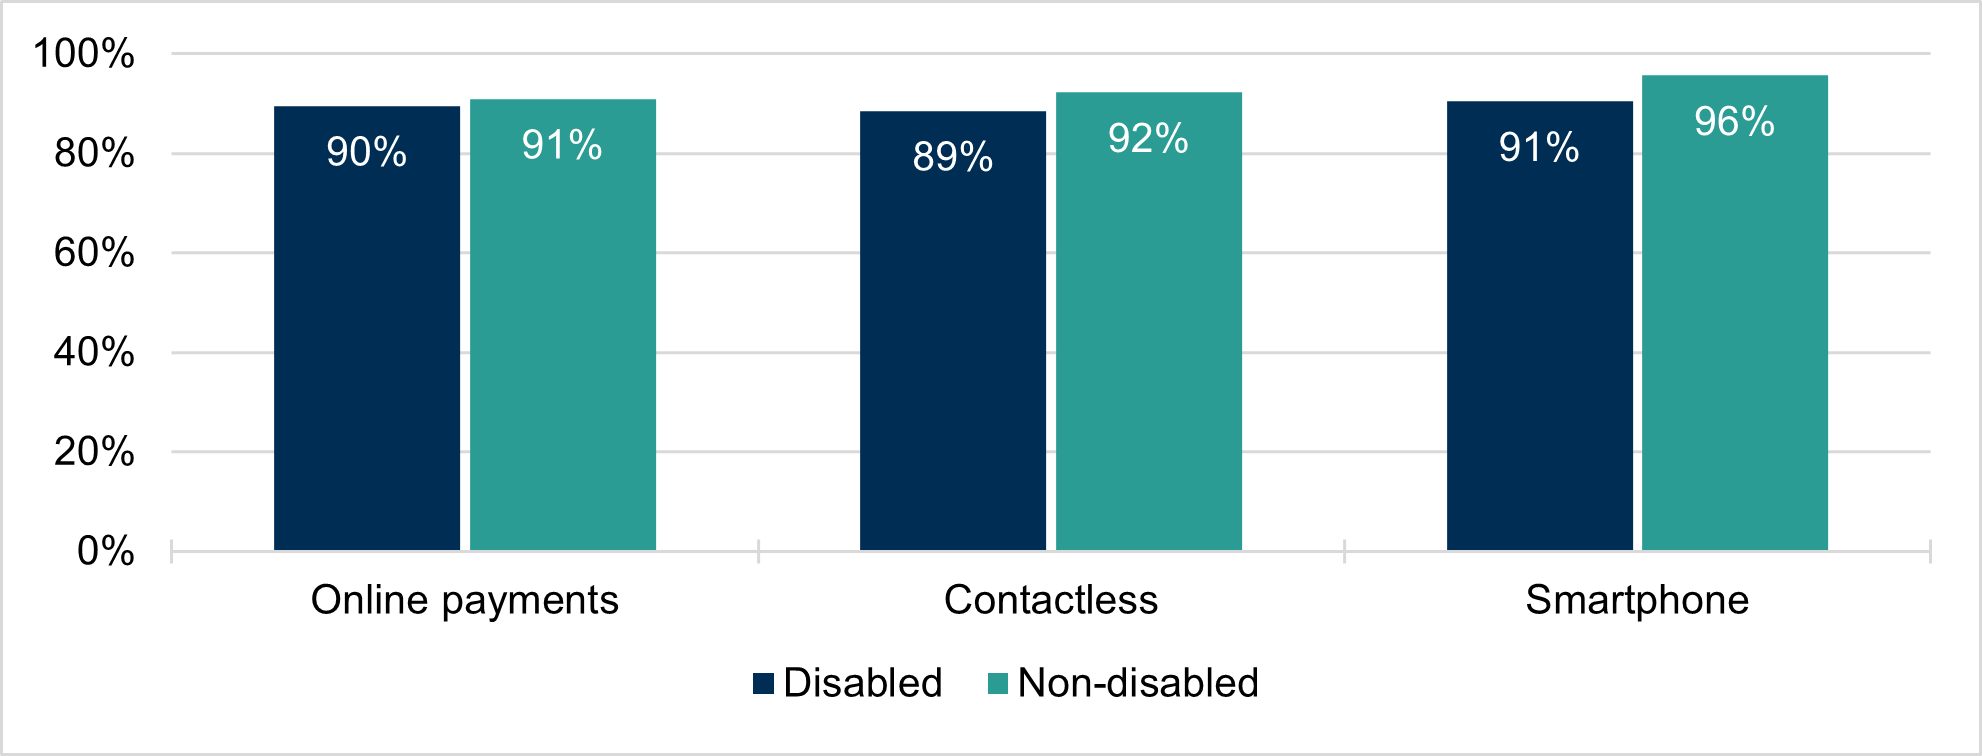
The legend is presented in the same order as the bars in the clusters.
Views on the themes of the survey
Respondents were asked to rank each of the three themes in order of importance to them.
Improved integrated ticketing was the most important theme to respondents, followed by improved smart ticketing, and lastly, improved journey planning.
Chart 8 highlights the most popular response at each level of importance. 49% of respondents indicated that the most important theme to them was improved integrated ticketing. The chart shows that improved smart ticketing was the second most important theme, while improved journey planning was the least important theme. These results align with many of the findings described below, where respondents emphasised the importance to them of integrated ticketing. The information in Chart 8 is also shown in Annex Table 5.
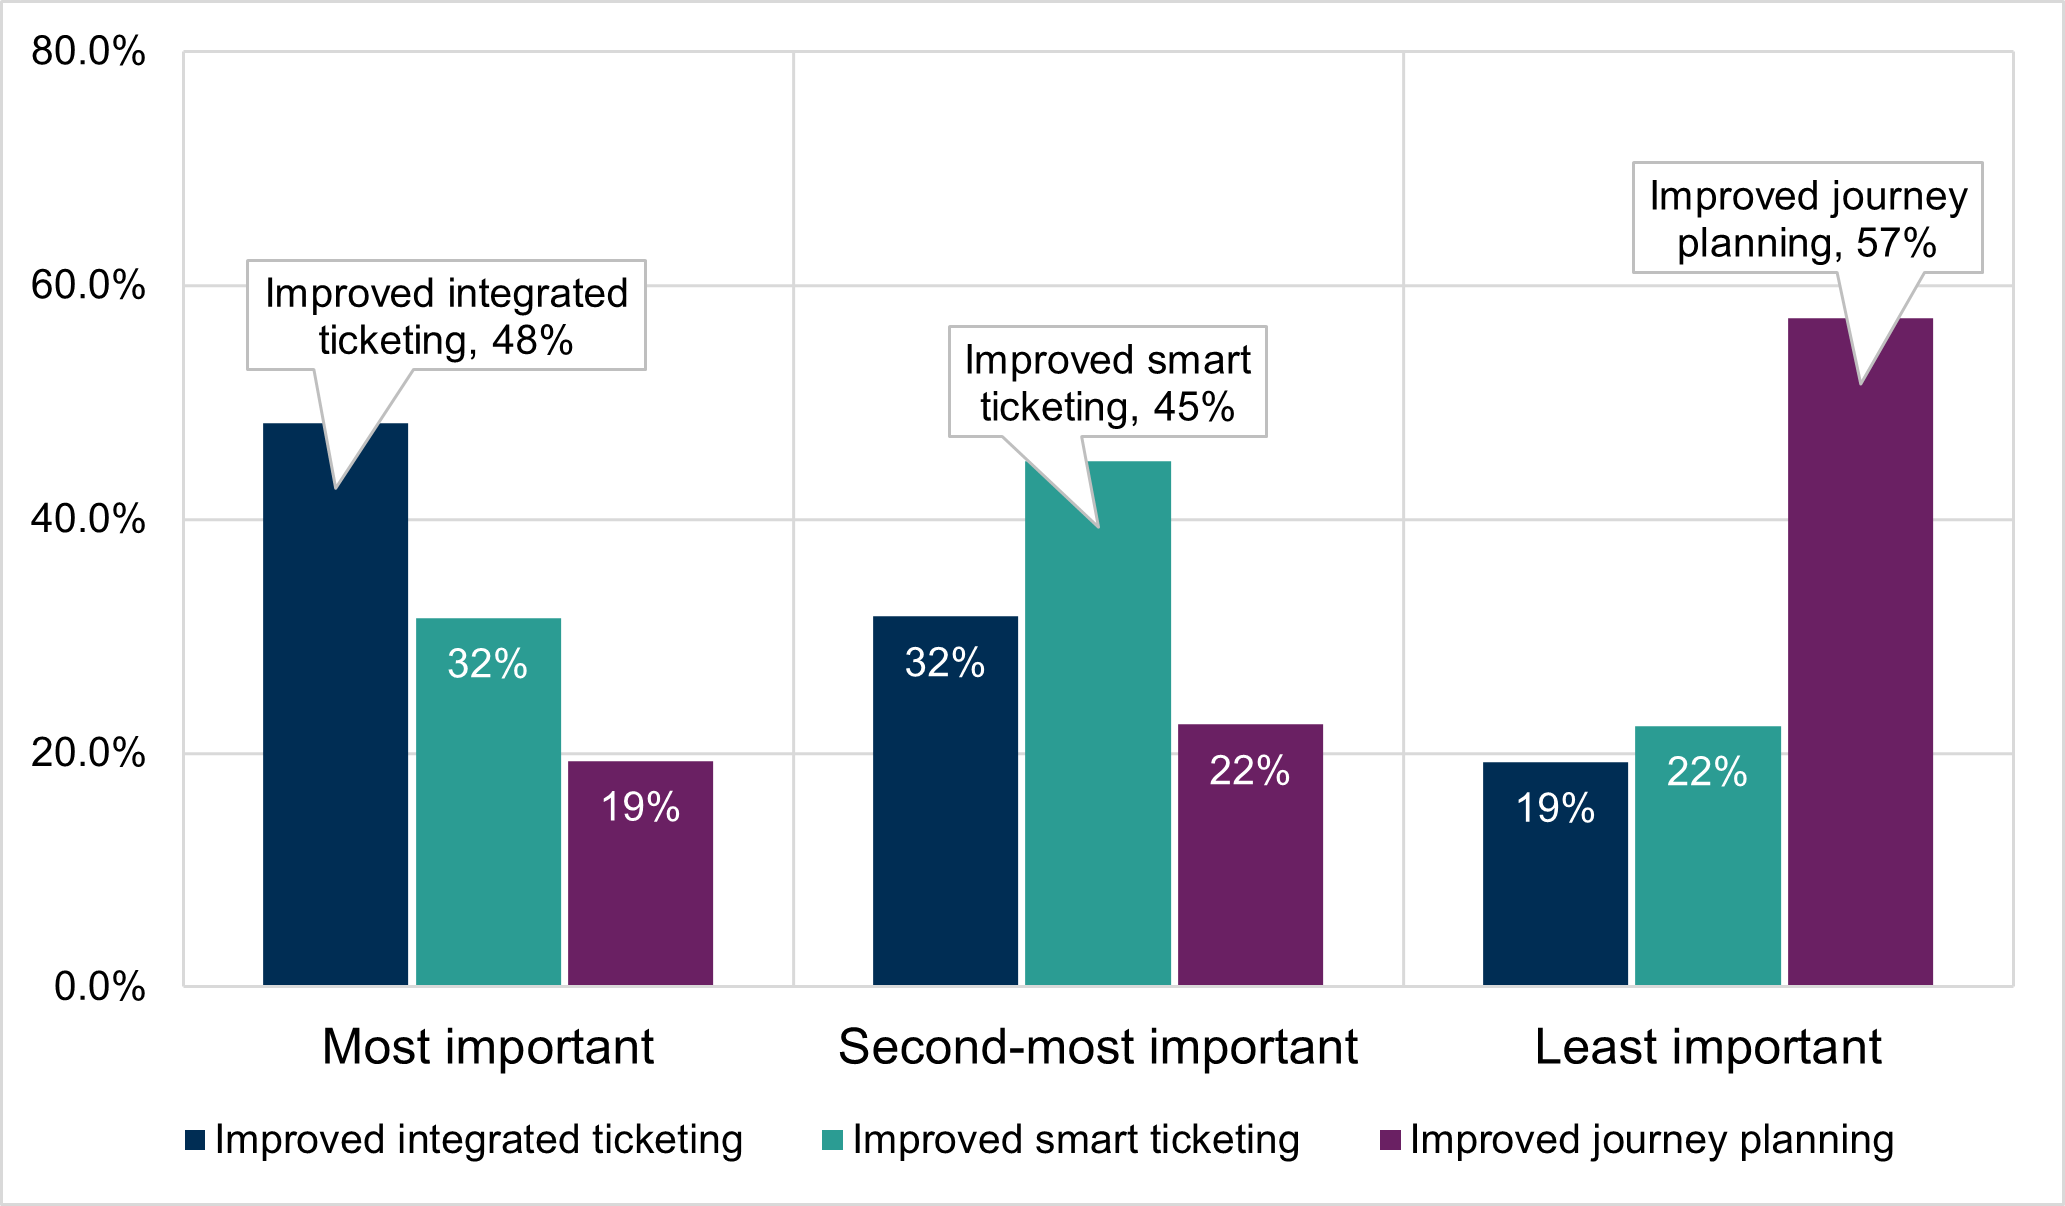
The legend is presented in the same order as the bars in the clusters.