Data analysis
Dataset
SCANNER survey data collected on the Scottish trunk road network in 2020/21 was processed to obtain SMTD and MPD values. The dataset comprised texture data gathered over 4,563 lane km of surfacing and the SMTD and MPD were reported in 10m averages. Table 3-1 provides a summary of the surface type and what proportion of the dataset it represented.
| Surface Designation | Length (Km) | Proportion of total dataset |
|---|---|---|
| Surface Course Clause 942 - 6mm | 71.8 | 1.6% |
| Surface Course Clause 942 - 10mm | 1,313.3 | 28.8% |
| Surface Course Clause 942 - 14mm | 1,424.5 | 31.2% |
| Surface Course TS2010 - 6mm | 89.4 | 2% |
| Surface Course TS2010 - 10mm | 1,346.2 | 29.5% |
| HRA | 318.0 | 7% |
| Total | 4,563.2 | 100% |
SMTD & MPD comparison
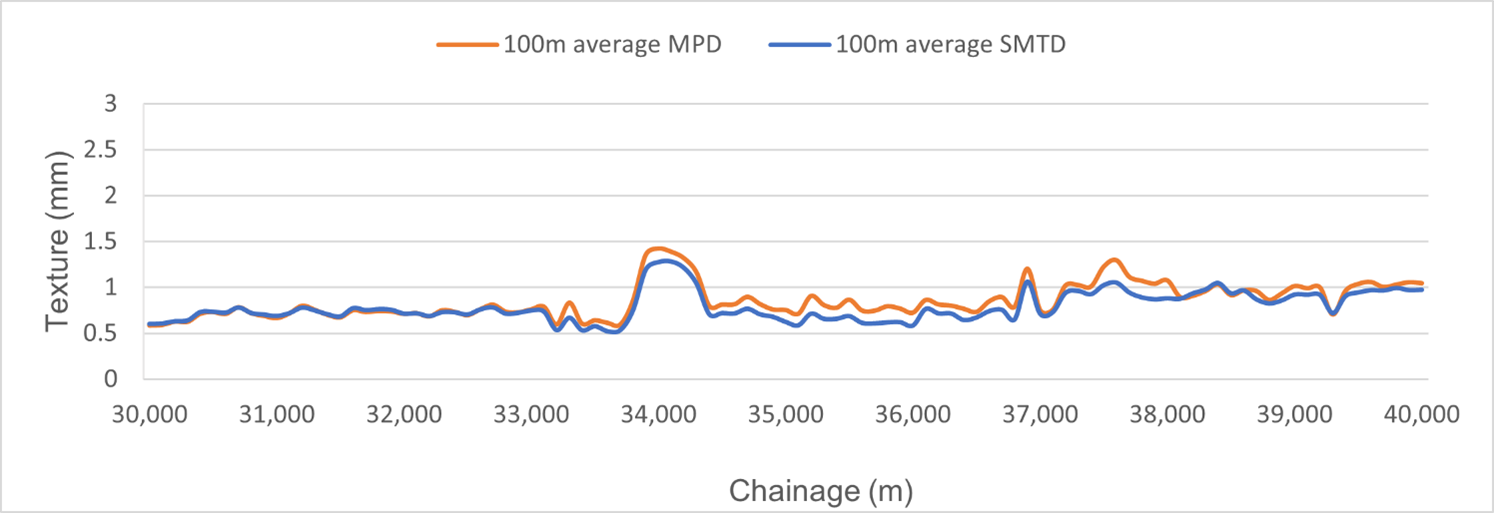
As described in section 2, SMTD and MPD estimate texture depth in a different way. Figure 3-1 represents a random 10km section of 6mm Clause 942 material and is based on 100m averaged data. It can be seen that the measures display similar trends but the difference in values changes over the length of the selected section. For example, it can be seen that the values are aligned for the first 3km (chainage 30-33km) but thereafter the MPD generally produces a higher estimate of texture.
SMTD versus MPD for all materials combined
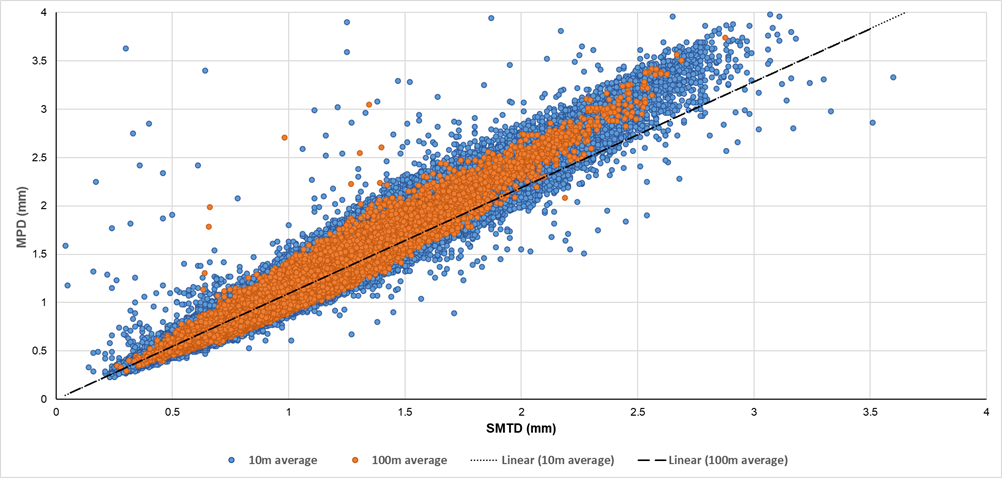
Figure 3-2 compares the SCANNER values of SMTD and MPD for the six surfacing materials tested, i.e. the whole 4,563 km dataset. The graph contains a significant number of data: 456,311 points (10m average), represented by the blue dots; and 45,631 points (100m average) in orange. A general linear relationship appears to be present and there is less scatter when the 100m average values are used. If a line of best fit, which is forced through zero, is applied, then the slope of the line is around 1.096 (10m average) and 1.094 (100m average). A visual inspection suggests the data points cease to be linear at higher SMTD texture depths and they appear to curve upwards from around 1.5mm. As the figure represents a very dense point cloud (0.5M points) and contains six different material types, it seems sensible to look at the spread of data and further examine the SMTD and MPD relationship for individual material types.
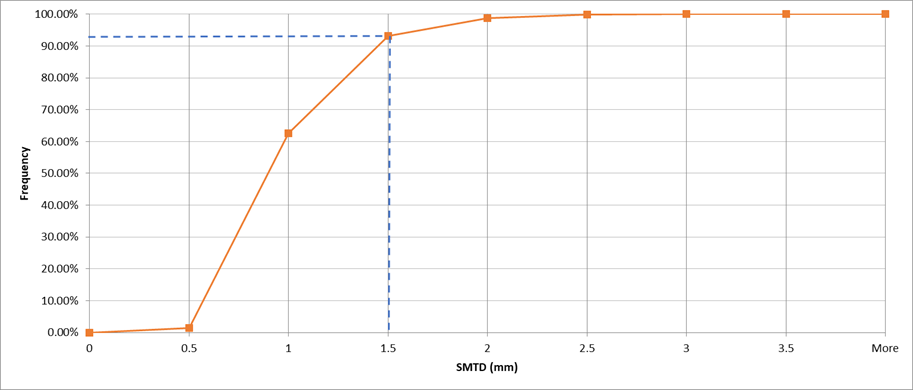
A cumulative distribution of the data was carried out to ascertain the overall frequency of texture values and the results are shown in Figure 3-3. The chart shows that 93.2% of the SMTD values are less than 1.5mm. This is not obviously clear from Figure 3-2 owing to the density and scatter of data points.
SMTD versus MPD for individual surface types
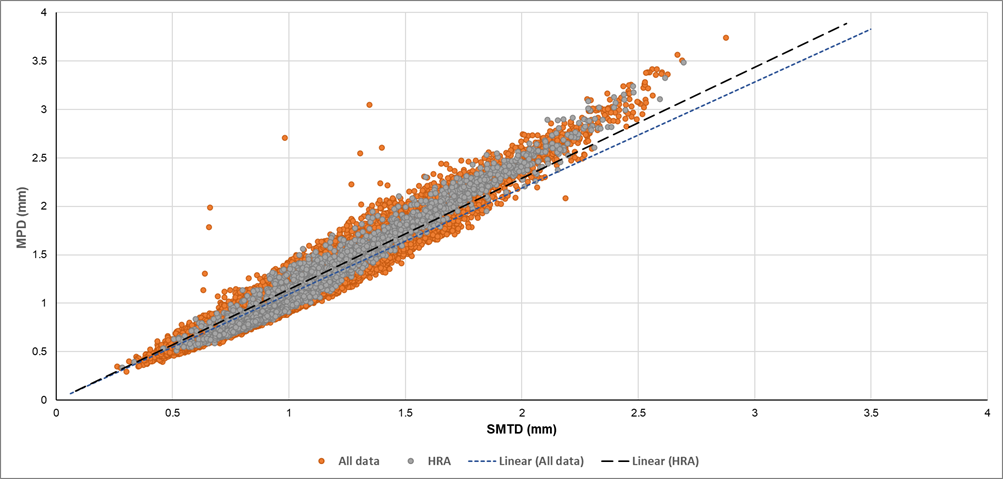
Figure 3-4 shows a comparison of SMTD and MPD for all the 100m average data for HRA, which is the only positive textured material. It can be seen that the slope of the line increases from the average of all data 1.094 to 1.146 for HRA.
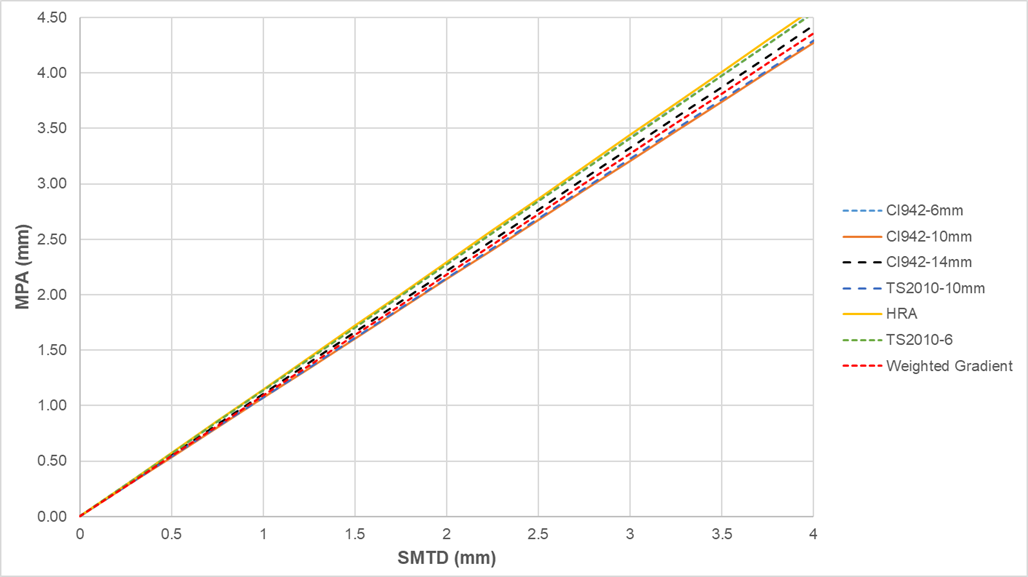
Plots for all the material types are shown in Appendix A (A-1 to A-7). Figure 3-5 shows the gradients achieved for each material type, which range from 1.069 to 1.146.
| Surface Designation | Length (Km) | Dataset proportion | Gradient | Text type |
|---|---|---|---|---|
| Surface Course Clause 942 - 6 mm | 71.77 | 2 | 1.137 | -ve |
| Surface Course Clause 942 - 10 mm | 1,313.25 | 29 | 1.069 | -ve |
| Surface Course Clause 942 - 14 mm | 1,424.50 | 31 | 1.107 | -ve |
| Surface Course TS2010 - 6 mm | 89.39 | 2 | 1.136 | -ve |
| Surface Course TS2010 - 10 mm | 1,346.16 | 30 | 1.074 | -ve |
| HRA | 318.04 | 7 | 1.146 | +ve |
| Average gradient | Not applicable | Not applicable | 1.112 | Not applicable |
| Weighted average gradient | Not applicable | Not applicable | 1.090 | Not applicable |
Table 3-2 summarises the relationships obtained from the different surfacing types examined. The weighted gradient was calculated using the proportion of data that each surface type contributed to the total dataset and is also shown in Figure 3-5.
SMTD values less than 1.5mm
In a similar study carried out for National Highways2 it was observed that more than 90% of SMTD values collected on the English network fell below 1.5mm. Likewise, the Scottish data collected in this study (Figure 3-3) showed that 93.2% of the SMTD values collected were less than 1.5mm. As the relationship between SMTD and MPA changes beyond 1.5mm, i.e. it shows a slight upward curve, or non-linear relationship, it was decided to examine the relationship between 0 and 1.5mm.
Plots for the entire dataset and all the material types for SMTD values less than 1.5mm are shown in Appendix B (B-1 to B-7). Figure 3-6 shows the respective gradients achieved for each material type. Although similar to Figure 3-5, the gradient range has reduced from 1.045 to 1.100. The latter reflects the closer relationship between SMTD and MPA when SMTD values of less than 1.5mm are used.
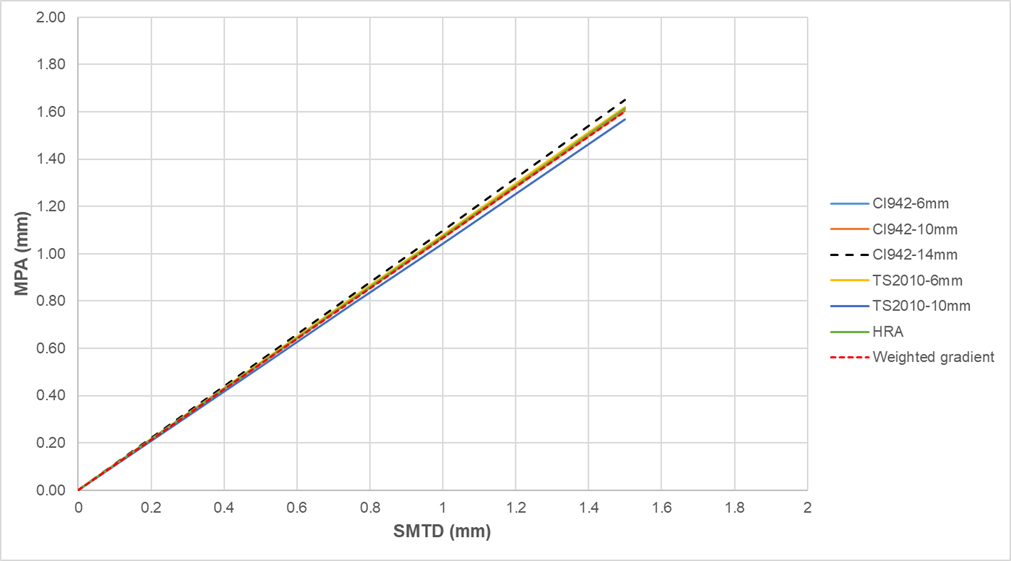
Table 3-3 summarises the revised relationships obtained from the different surfacing types when only SMTD < 1.5mm was used, i.e. the lengths exclude any 100m section that contains SMTD ≥ 1.5mm. The weighted average gradient of 1.068 is also shown on Figure 3-6.
| Surface Designation | Length (Km) | Dataset proportion | Gradient | Text type |
|---|---|---|---|---|
| Surface Course Clause 942 - 6 mm | 70.29 | 2 | 1.077 | -ve |
| Surface Course Clause 942 - 10 mm | 1261.93 | 30 | 1.056 | -ve |
| Surface Course Clause 942 - 14 mm | 1282.61 | 30 | 1.100 | -ve |
| Surface Course TS2010 - 6 mm | 80.68 | 2 | 1.081 | -ve |
| Surface Course TS2010 - 10 mm | 1293.73 | 30 | 1.045 | -ve |
| HRA | 251.43 | 6 | 1.075 | +ve |
| Average gradient | Not applicable | Not applicable | 1.072 | Not applicable |
| Weighted average gradient | Not applicable | Not applicable | 1.068 | Not applicable |
Impact on Maintenance assessment
Transport Scotland use SCANNER texture depths (SMTD) for maintenance assessment reasons to define the condition of surfaces on the network. Table 3-4 shows the current criteria for surfaces, excluding high friction surfaces, and is based on the SNAA of CS 230.
| Condition category | Definition | Texture depth (mm) |
|---|---|---|
| Green | Sound - negligible deterioration | >0.7mm |
| Amber | Some to moderate deterioration | 0.4mm< [SMTD] ≤0.7mm |
| Red | Moderate to severe deterioration | ≤0.4mm |
The two weighted average gradients for SMTD and MPD have been used to assess the impact of adopting MPD in preference to SMTD. It would be preferable if one of these single relationships could be used, rather than by surface type. Table 3-5 presents the proposed thresholds for MPD using the two weighted average gradients, i.e.: 1) all data; and 2) less than 1.5mm. This essentially means that the SMTD criteria (0.7mm & 0.4mm) have been multiplied by 1.09 and 1.068, respectively, and rounded to two decimal places.
| Condition category | SMTD (mm) | MPD1 (mm) | MPD2 (mm) |
|---|---|---|---|
| Green | >0.7mm | >0.76mm | >0.75 mm |
| Amber | 0.4mm< [SMTD] ≤0.7mm | 0.44mm< [MPD] ≤0.76mm | 0.43mm< [MPD] ≤0.75mm |
| Red | ≤0.4mm | ≤0.44mm | ≤0.43mm |
Comparison Matrix
Comparison matrices can be used to assess the effect of adopting MPD rather than SMTD for the two different relationships observed. Table 3-6 has been created as an example of a comparison matrix and how it can be used.
| Category | SMTD Green | SMTD Amber | SMTD Red |
|---|---|---|---|
| MPD Green | 80% | 5% | 5% |
| MPD Amber | 20% | 90% | 15% |
| MPD Red | 0% | 5% | 80% |
The example matrix shown in Table 3-6 shows the proportion of 100m average lengths reported in each category if the MPD thresholds were used rather than the SMTD values. For example, the first column titled Green, the 80%, 20%, 0% scores mean the following:
- 80% - Using MPD values and the MPD thresholds, only 80% of the 100m average lengths identified by SMTD would be classified as being in the Green condition category.
- 20% - Using MPD values and MPD thresholds, 20% of the 100m average lengths identified by SMTD as being in the Green category were classified Amber using MPD.
- 0% - neither SMTD nor MPD would have classified any 100m average length as being in the Red condition category using the thresholds for Green.
To obtain the data for the comparison matrix, three calculations were undertaken:
- Firstly, the SMTD and MPD 100 m average lengths were placed in columns and arranged by chainage.
- Secondly, each length was categorised into Green, Amber and Red using the current SMTD and the new proposed MPD thresholds shown in Table 3-5.
- Finally, the respective condition categories were directly compared to see whether they matched or were different and the proportions were calculated and reported.
It should be noted that the sum of each column adds up to 100% and the diagonal values, highlighted in red, are important as they report the largest value for each condition category. In an ideal scenario, where SMTD and MPD classified all the 100m lengths in the same condition category, each of these values would be 100%.
MPD performance using threshold based on all SMTD data
Table 3-7 shows the results if the MPD values were used with the threshold that was derived using the weighted average gradient of the total dataset; the latter produced MPD thresholds of 0.76mm and 0.44mm. In addition to using percentages, Table 3-7 also shows the lengths reported in each category. The latter has been used to highlight that although the performance can appear poor, the length classified is also important. For example, the 73.3% reported in the Red category only relates to 2.2km. The lengths reported in the table add up to the total dataset of 4,563km.
| Category | SMTD (%) Green | SMTD (%) Amber | SMTD (%) Red | SMTD (km) Green | SMTD (km) Amber | SMTD (km) Red |
|---|---|---|---|---|---|---|
| MPD (% or km) Green | 91.7% | 7.1% | 0% | 3,659.5 | 40.4 | 0 |
| MPD (% or km) Amber | 8.3% | 92.9% | 26.7% | 330.6 | 529.7 | 0.8 |
| MPD (% or km) Red | 0% | 0% | 73.3% | 0 | 0 | 2.2 |
MPD performance using threshold based on SMTD data less than 1.5mm
Table 3-8 shows the results if the MPD values were used with the threshold that was derived using the weighted average gradient of SMTD data less than 1.5mm; the latter produced MPD thresholds of 0.75mm and 0.43mm. Table 3-8 also shows the lengths reported in each category.
| Category | SMTD (%) Green | SMTD (%) Amber | SMTD (%) Red | SMTD (km) Green | SMTD (km) Amber | SMTD (km) Red |
|---|---|---|---|---|---|---|
| MPD (% or km) Green | 93.2% | 8.9% | 0% | 3,718.5 | 50.9 | 0 |
| MPD (% or km) Amber | 6.8% | 91.1% | 43.3% | 271.6 | 519.2 | 1.3 |
| MPD (% or km) Red | 0% | 0% | 56.7% | 0 | 0 | 1.7 |