Findings
Initial impacts - demand
Rail demand fell significantly (to less than 10% of pre-pandemic levels) during the pandemic but then rose steadily to September 2023. A key issue in establishing a counterfactual to analyse the impact of the peak fares Pilot, is to what extent the post-pandemic rises could have been expected to continue, in the absence of any intervention, and to what extent demand was likely to level out. The current situation is illustrated in the chart on the following page that includes both the actual changes in demand and the statistical estimates of impact.
Each year ScotRail estimate the number of daily journeys for the forthcoming financial year for budgetary purposes. The simplest way to assess the impact of the peak fares Pilot on demand is to compare actual journeys with these ScotRail projections which were undertaken without accounting specifically for the peak fares Pilot.
This estimates there have been around 2.1 million fewer journeys since the start of the Pilot than originally estimated – a fall of 4.2%. However, this simplistic analysis does not account for the bad weather and network closures seen during the October to February period. Simply eliminating these events from the data shows a fall of around 650,000 journeys or 1.7%.
A significantly more sophisticated approach has been developed which uses statistical techniques to account for a range of factors that influence rail demand on a daily basis. These are:
- Longer term trends in demand
- Day of the week factors – demand varies across days of the week
- Seasonal Factors – demand varies over the course of the year (this is already incorporated into ScotRail estimates)
- One off -events – Data on bad and extremely bad weather events, large Sporting and/or Cultural events and Strike Action, as well as the Christmas/New Year period.
- A proxy for overall travel demand
The approach is to use data dating back to April 2022 (when the immediate pandemic impacts were diminished) and estimate a model based on the above factors which includes overall trend growth in rail demand and captures the impact of the Peak Fares Pilot in 2 ways:
- A “Pilot Impact” variable (represents an immediate shift in demand from the start of the Pilot
- A “Pilot Trend” variable (represents the additional daily trend in demand from the start of the Pilot).
This resulted in 28 variables being used within the analysis. The approach is to statistically estimate a model using all 28 variables and then progressively eliminate variables which are not statistically significant until the model is stable. This model is compared with the actual levels of demand in the diagram below.
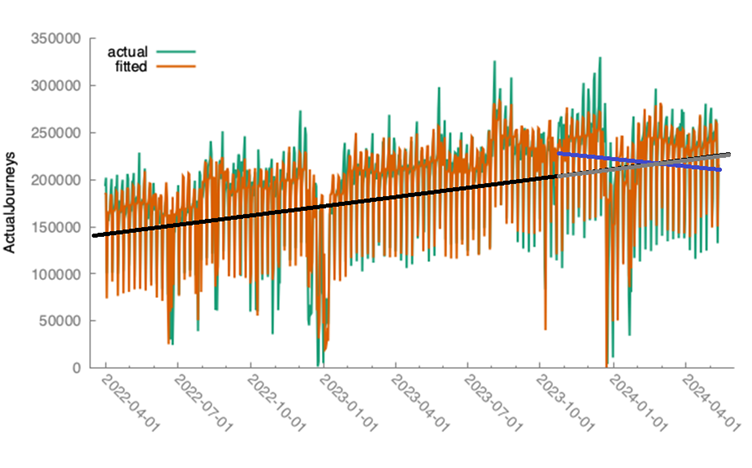
The diagram illustrates the significant variation over days of the week and over time – the results of this more advanced method of analysis are reported below with full details of the advanced approach in Appendix A.
The black line shows the trend before the Pilot and the grey line where demand would be if it had continued, whilst the blue line shows the initial positive impact of the Pilot and where demand is now. There was an initial positive impact over the first 3 months but looking at the full data, demand has declined to around the levels at the begining of the Pilot.
This model is then used to estimate journeys with and without the Pilot in place (the latter by excluding the two Peak Fares variables).
This has been done over 4 separate time periods:
- First 11 weeks (to 17 Dec 23 – to avoid Christmas/New Year)
- First 3 months (to end Dec 23)
- First 6 months (to end March 24)
- All available data (to 13 May).
|
Period |
Actual demand over the period |
Cumulative change in demand (journeys) estimated since removal of peak fares |
Percentage change in demand estimated since removal of peak fares |
|
11 weeks |
17.8 m |
565,000 |
3.18% |
|
3 months |
20.5 m |
809,000 |
3.95% |
|
6 months |
39.8 m |
-1,305,000 |
-3.28% |
|
To 13 May |
49.3 m |
-1,627,000 |
-3.29% |
Whilst the impact over 6 months onwards is negative this should not be interpreted as the Pilot causing a fall in demand (particularly in the context of the initial positive impact) as there is no evidence of any specific factors that could be causal (e.g. overcrowding etc.). At this point, the analysis simply states that accounting for all factors so far considered, rail demand as a whole is around the same as it was before the Pilot started compared with the fact that it was rising in the run-up to the Pilot.
The analysis includes a variable that is a proxy for overall travel demand (excluding rail). This is statistically significant and has a positive sign – rail demand varies in line with overall demand quite strongly. However, the variation in rail demand seems to have strengthened since January 24 – this is being explored further.
One possible hypothesis is that a greater reliance on leisure travel has caused rail to be more sensitive to overall seasonality and especially the relatively poor weather over the associated period, or potentially sensitive to the impact on household finances post the December festive period. This hypothesis is not specifically supported by the inclusion of the overall travel demand variable but nor does this discount it and will be explored further. Analysts are exploring timely Economic Data released by the Office of National Statistics to assess this hypothesis.