Results
This section details the results in terms of demand, costs and value for money.
Demand
The results of the econometric modelling are shown in the table below.
| Type | M1: Model 1 All Basic | M2: Model 2 All T90 Pre-Covid Demand | M3: Model 3 All T80 Pre-Covid Demand | M4: Model 4 All T Oct23 | M5: Model 5 All T100 Pre-Covid Demand |
|---|---|---|---|---|---|
| % Increase in Demand over Trial Period | -5.07% | 6.81% | 15.90% | 2.36% | 0.0% |
| Fare change | -16.8% | -16.8% | -16.8% | -16.8% | -16.8% |
| Elasticity | 0.30 | -0.41 | -0.95 | -0.14 | 0.00 |
The preferred scenario (M2) shows that the best estimate of demand impacts is that the Pilot increased demand by around 6.8%. This is subject to considerable variation with the M4 scenario (demand stabilised before the Pilot) showing an increase in demand of 2.4% and the M5 scenario (that demand would have increased to pre-C19 levels) showing that the Pilot had no impact. Scenario M1 and M3 are considered to be out with a reasonable range (giving results of a reduction of demand of around 5% and an increase in demand of around 16% respectively).
Whilst the M2 scenario is used for subsequent regional analysis, it is reasonable to suppose that the results lie between M2 and M4 – an increase in demand of between 2.4% and 6.8%.
Regional variations in demand
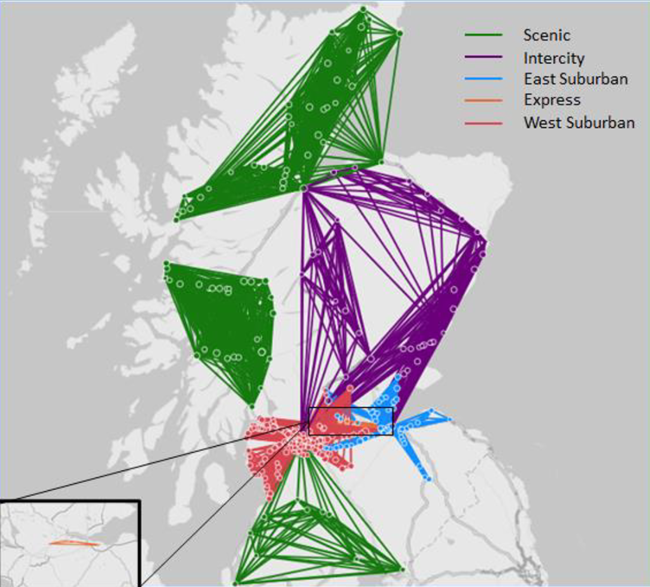
There is significant regional variation. The Table below shows the impact across ScotRail Service Groups (SRSG) which are illustrated in the diagram.

The implied elasticities, which account for other factors outwith the trial, are in line with ranges within the Passenger Demand Forecasting Handbook. Elasticities on Express (Edi-Glasgow via Falkirk High), Intercity and West Suburban are similar with the differences in demand change arising from different changes in the average fare.
| Type | Express T90 | Intercity T90 | West Suburban T90 | East Suburban T90 | Scenic T90 |
|---|---|---|---|---|---|
| % Change in Demand Over Trial Period | 8.86% | 3.54% | 7.07% | 13.66% | 6.45% |
| Fare change | -27.5% | -9.2% | -17.0% | -16.9% | -8.3% |
| Elasticity | -0.32 | -0.38 | -0.42 | -0.81 | -0.78 |
Elasticities for East Suburban and Scenic are higher (more sensitive) but subject to considerable variation at sub-SRSG level. At all SRSG levels the elasticities are between 0 and -1 which means that demand is inelastic (the demand response is lower than the change in price) with respect to price. The impacts in terms of demand are highest on East Surburban routes and Express (Edinburgh-Glasgow via Falkirk High) with the West Suburban next highest meaning that the impacts are greatest in the Central Belt.
Analysis of Gateline data
Gateline data (boardings, alightings and total) is available for 17 stations (22 platforms) on a half-hour basis for the period 1/10/22 to 2/7/24. The 17 stations are:
- Aberdeen
- Anderston
- Argyle Street
- Bathgate
- Charing Cross
- Dundee
- Edinburgh Gateway
- Edinburgh Park
- Exhibition Centre
- Glasgow CenP 3-6
- Glasgow CenP 7-8
- Glasgow CenP 9-10
- Glasgow Central LL
- Glasgow CP11-15
- Glasgow Qn St LLv
- Glasgow Queen street
- Haymarket
- Inverness
- Motherwell
- Perth
- Stirling
- Waverley
Note that there are several caveats with the usefulness of the data in terms of assessing the impact of the peak fares Pilot. The extent of it (approx. 1.5 million data points) means it is difficult to present but it should also be noted that when stations are particularly busy, the gatelines tend to be switched off to avoid crowding etc. and some stations are known to do this more commonly than others due to the physical layout presenting greater issues. A further issue is that the analysis is focused on boardings (as these can be accurately mapped to the am and pm peaks). Alightings are more problematic as there is no way of knowing (especially in the PM peak) at what time any particular journey started (and thus if it was previously subject to a peak fare) as there is no station-to-station information.

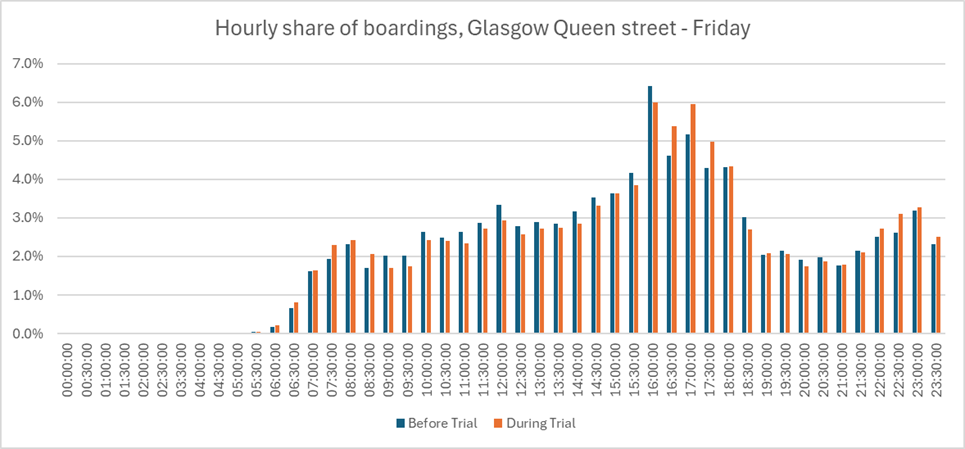
The example above shows the hourly share of boardings at Glasgow Queen Street (High Level) on Fridays for illustration purposes rather than reporting everything. Flows into Glasgow Queen Street show a significant impact Mon-Fri of an increased share of demand in both the AM and PM peaks with the biggest impact between 17:00 and 17:30. There is little to no sign of peak spreading in terms of overall share of demand. There is significant nighttime demand on a Friday which has increased during the trial period.
In terms of other stations, Haymarket shows increased PM Peak demand (and to a lesser extent in the AM Peak) but at a lower level than Queen Street. There is a less pronounced Friday evening impact. Stirling shows significant increases in the PM peak (significantly greater than at other stations examined). This is most pronounced Monday to Thursday. For Inverness, there is relatively little AM and PM peak demand, and it is relatively unchanged over the trial with minor increases in the PM Peak on Wednesdays and Thursdays. Aberdeen shows small increases in AM Peak demand and no real pattern to the changes on PM peak. The biggest impact is a significant increase in demand over the 15:30 to 16:00 period. This may be due to timetable changes.
Looking across all 17 stations the overall picture is in line with the wider demand estimates with some localised exceptions (eg Motherwell) which are likely to be due to timetable changes and interactions with other train operators.