Methodology
The impact on demand has been estimated using the same econometric approach that was used in the TS Interim report that covered the period to mid-May 2024 (ScotRail Peak Fares Removal Pilot - Interim Evaluation Report | Transport Scotland) but applied to data to 3 July 2024. Details of the methodology can be found in Annex A but the basic approach is to estimate the impact of the Pilot using a “dummy variable” (1 when it is in place, 0 otherwise) and an additional trend variable alongside a range of other variables to account for factors such as the day of the week, wider seasonality, bad weather, large scale events and the impact of the fare rise in April 2024 as well as general levels of (road) travel across Scotland. The analysis is undertaken at National level and then across the 5 ScotRail service groups.
Value for Money is calculated using the Transport Model for Scotland (TMfS) calibrated to the actual results from the econometric analysis. Whilst the nature of the Peak Fares Pilot is different to a “normal” transport infrastructure project (in that it simply changes price rather than the network) the methodology used to determine VfM (including carbon savings) is identical to that normally used across all transport investment– the benefits arise from changes in the Generalised Cost of Travel (Time and Money) to existing and new users, as is standard for any other scheme, meaning the results are consistent with the analysis of other (including infrastructure) projects. See Annex B.
The only distinctions are that for existing users, there is no change in the time component of Generalised Cost and that there is no infrastructure cost to Government – costs are the net impact on revenue and additional costs incurred by SR and the subsequent changes to the ScotRail level of subsidy required. New users during the Pilot, as measured by the change in demand, switch to rail because they are better off in terms of either time or money or both and this is captured in a standard way by the analysis.
The impact on revenue is calculated in 2 ways:
- similar econometric analysis to that on demand but with revenue as the dependent variable
- and by the approach developed using the Transport Model for Scotland (TMfS) whereby a run of the model was undertaken before the results of the trial were known and then set-up in such a way that the results can be calibrated to the estimated impacts on demand.
The counterfactual
As discussed in the Interim report, the key analytical issue for analysing the Pilot is around what would have happened if it had not been in place – the counterfactual. Significant work has been undertaken examining possible scenarios.
5 main scenarios have been considered. The key factor is how demand recovered compared with pre-Covid 19 levels before the Pilot started and how this would have continued in the absence of the Pilot. There remains considerable uncertainty around the counterfactual which means that results are presented as a range.
- M1 - Assume recovery trend pre-Pilot continued.
- M2 - Assume recovery stabilised at 90% of pre-C19 demand (Demand at end Jul 23) – Equivalent to the rUK position and considered the primary scenario
- M3 - Assume recovery stabilised at 80% of pre-C19 demand (Demand at end Mar 2023)
- M4 - Assume recovery stabilised at end Sept 2023 (Before trial started)
- M5 - Assume recovery trend continued to 100% pre-C19 demand (End Nov 2023) and then would have stabilised at this level
Discussion of scenarios
The scenarios are illustrated in the diagram below. Note that the “Journeys” line shows actual demand and does not account for variations due to external factors – the large dips and peaks in demand in the diagram - the subsequent econometric analysis takes these into consideration.
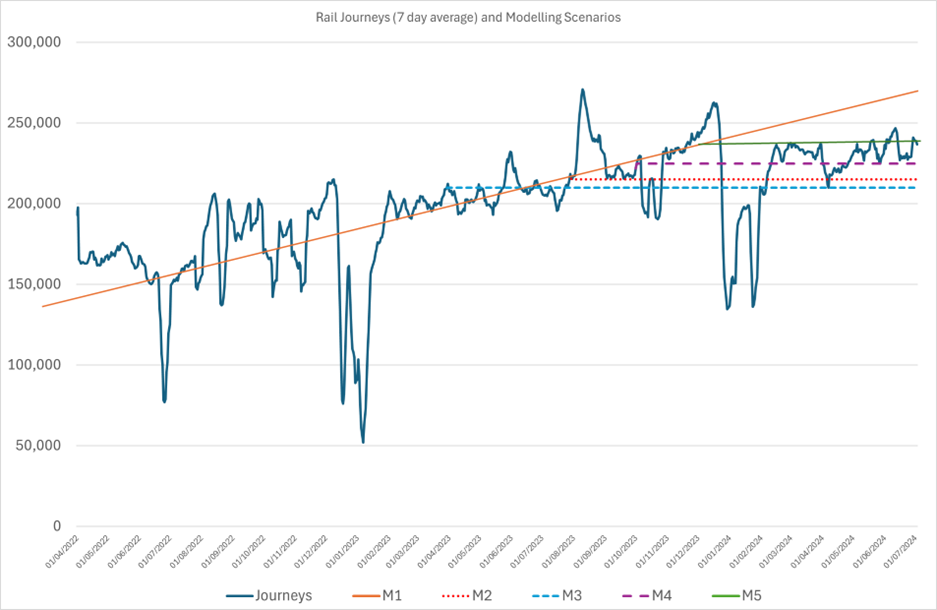
Scenario M1 assumes demand would have grown significantly above pre-C19 levels and would have been at around 115%-120% of Pre-C19 levels by July 2024 which is significantly higher than the actual levels seen.
Scenario M2 matches rail demand in the rest of the UK (broadly, estimates are that UK rail demand has recovered to 87% of pre-C19 levels, ignoring the new Elizabeth line in London) and it matches the data in the period preceding the Pilot. The M2 scenario is considered to be the strongest and closest to likely actuals of those considered. But there are a number of reasons (that are difficult to formally assess analytically) why it can be considered as being at the high end of a range:
- less industrial action (in 2023-24) in Scotland meaning demand in the rest of the UK is depressed compared with Scotland
- impact of public ownership in Scotland (potential positive impact)
- growth in leisure market in Scotland due to tourism (higher tourism numbers relative to population)
- whilst demand was above M2 levels over the first few weeks of September 2023 (before the Pilot started) there is evidence (see later econometric results) that this was due to seasonal factors and one-off events.
Scenario M3 (demand stabilised at 80% of pre C-19) levels is included primarily for illustration purposes. Scenario M4 is a prudent view i.e. demand was stable before the Pilot started. Scenario M5 (that demand would have recovered to pre-C19 levels without the Pilot in place is included for illustrative purposes only – there is no real evidence that this would have been the case (particularly in comparison with the position in the rest of the UK).