Table 32: Reported casualties by age and severity, separately for each mode of transport
Table 32: Reported casualties by age and severity, separately for each mode of transport
Numbers and rates per thousand population
| Mode of Transport | Age group | All | All | ||||||
|---|---|---|---|---|---|---|---|---|---|
| Killed | Adjusted serious | Adjusted slight | Severities | Killed | Adjusted serious | Adjusted slight | Severities | ||
| numbers | rates per thousand population | ||||||||
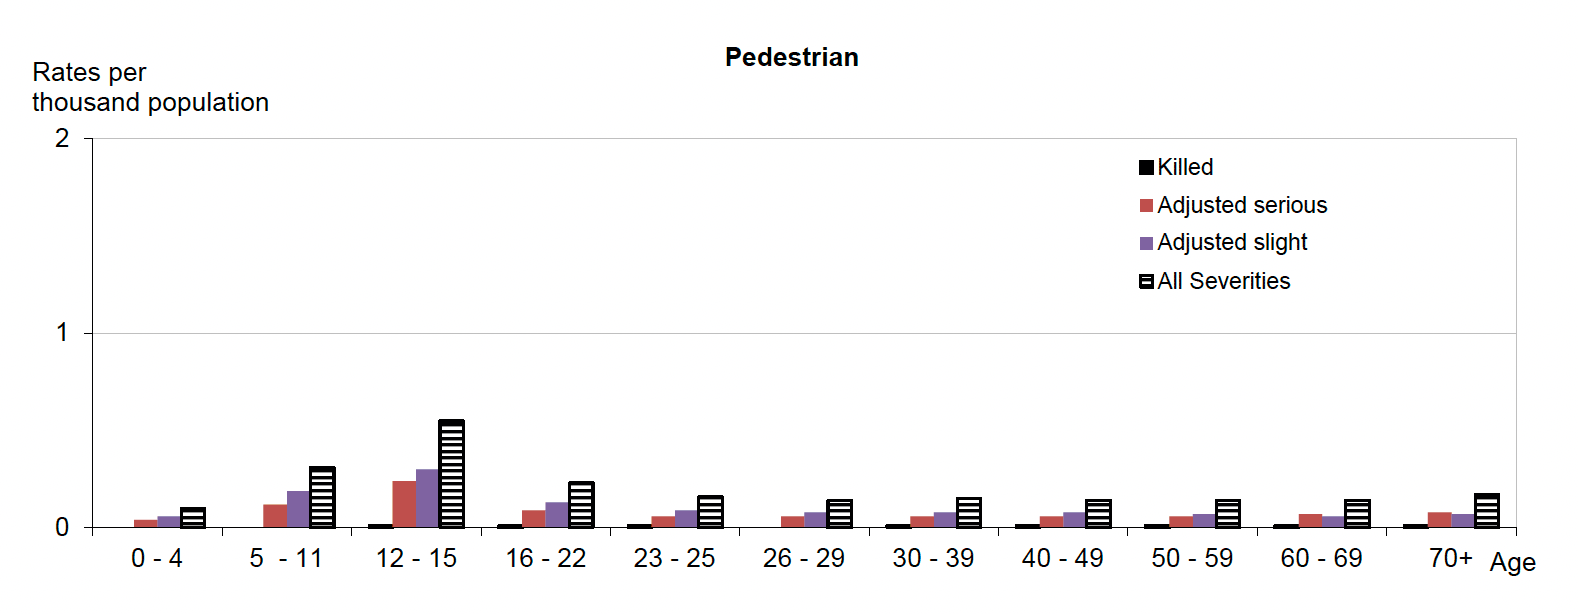
| Pedestrian | 0 - 4 | 1 | 10 | 16 | 27 | - | 0 | 0 | 0.10 |
| 5 - 11 | - | 51 | 80 | 131 | - | 0 | 0 | 0.31 | |
| 12 - 15 | 1 | 55 | 71 | 128 | 0.01 | 0 | 0 | 0.55 | |
| 16 - 22 | 2 | 37 | 57 | 98 | 0.01 | 0 | 0 | 0.23 | |
| 23-25 | 1 | 13 | 20 | 34 | 0.01 | 0 | 0 | 0.16 | |
| 26-29 | 1 | 17 | 24 | 43 | - | 0 | 0 | 0.14 | |
| 30 - 39 | 5 | 46 | 61 | 112 | 0.01 | 0 | 0 | 0.15 | |
| 40 - 49 | 4 | 39 | 53 | 97 | 0.01 | 0 | 0 | 0.14 | |
| 50 - 59 | 5 | 48 | 57 | 112 | 0.01 | 0 | 0 | 0.14 | |
| 60 - 69 | 6 | 43 | 39 | 88 | 0.01 | 0 | 0 | 0.14 | |
| 70 & over | 10 | 64 | 52 | 127 | 0.01 | 0 | 0 | 0.17 | |
| Total 1 | 37 | 423 | 531 | 1,001 | 0.01 | 0 | 0 | 0.18 | |
| Child 0-15 | 2 | 116 | 167 | 286 | - | 0 | 0 | 0.31 | |
| Adult 16+ | 35 | 307 | 363 | 713 | 0.01 | 0 | 0 | 0.16 | |
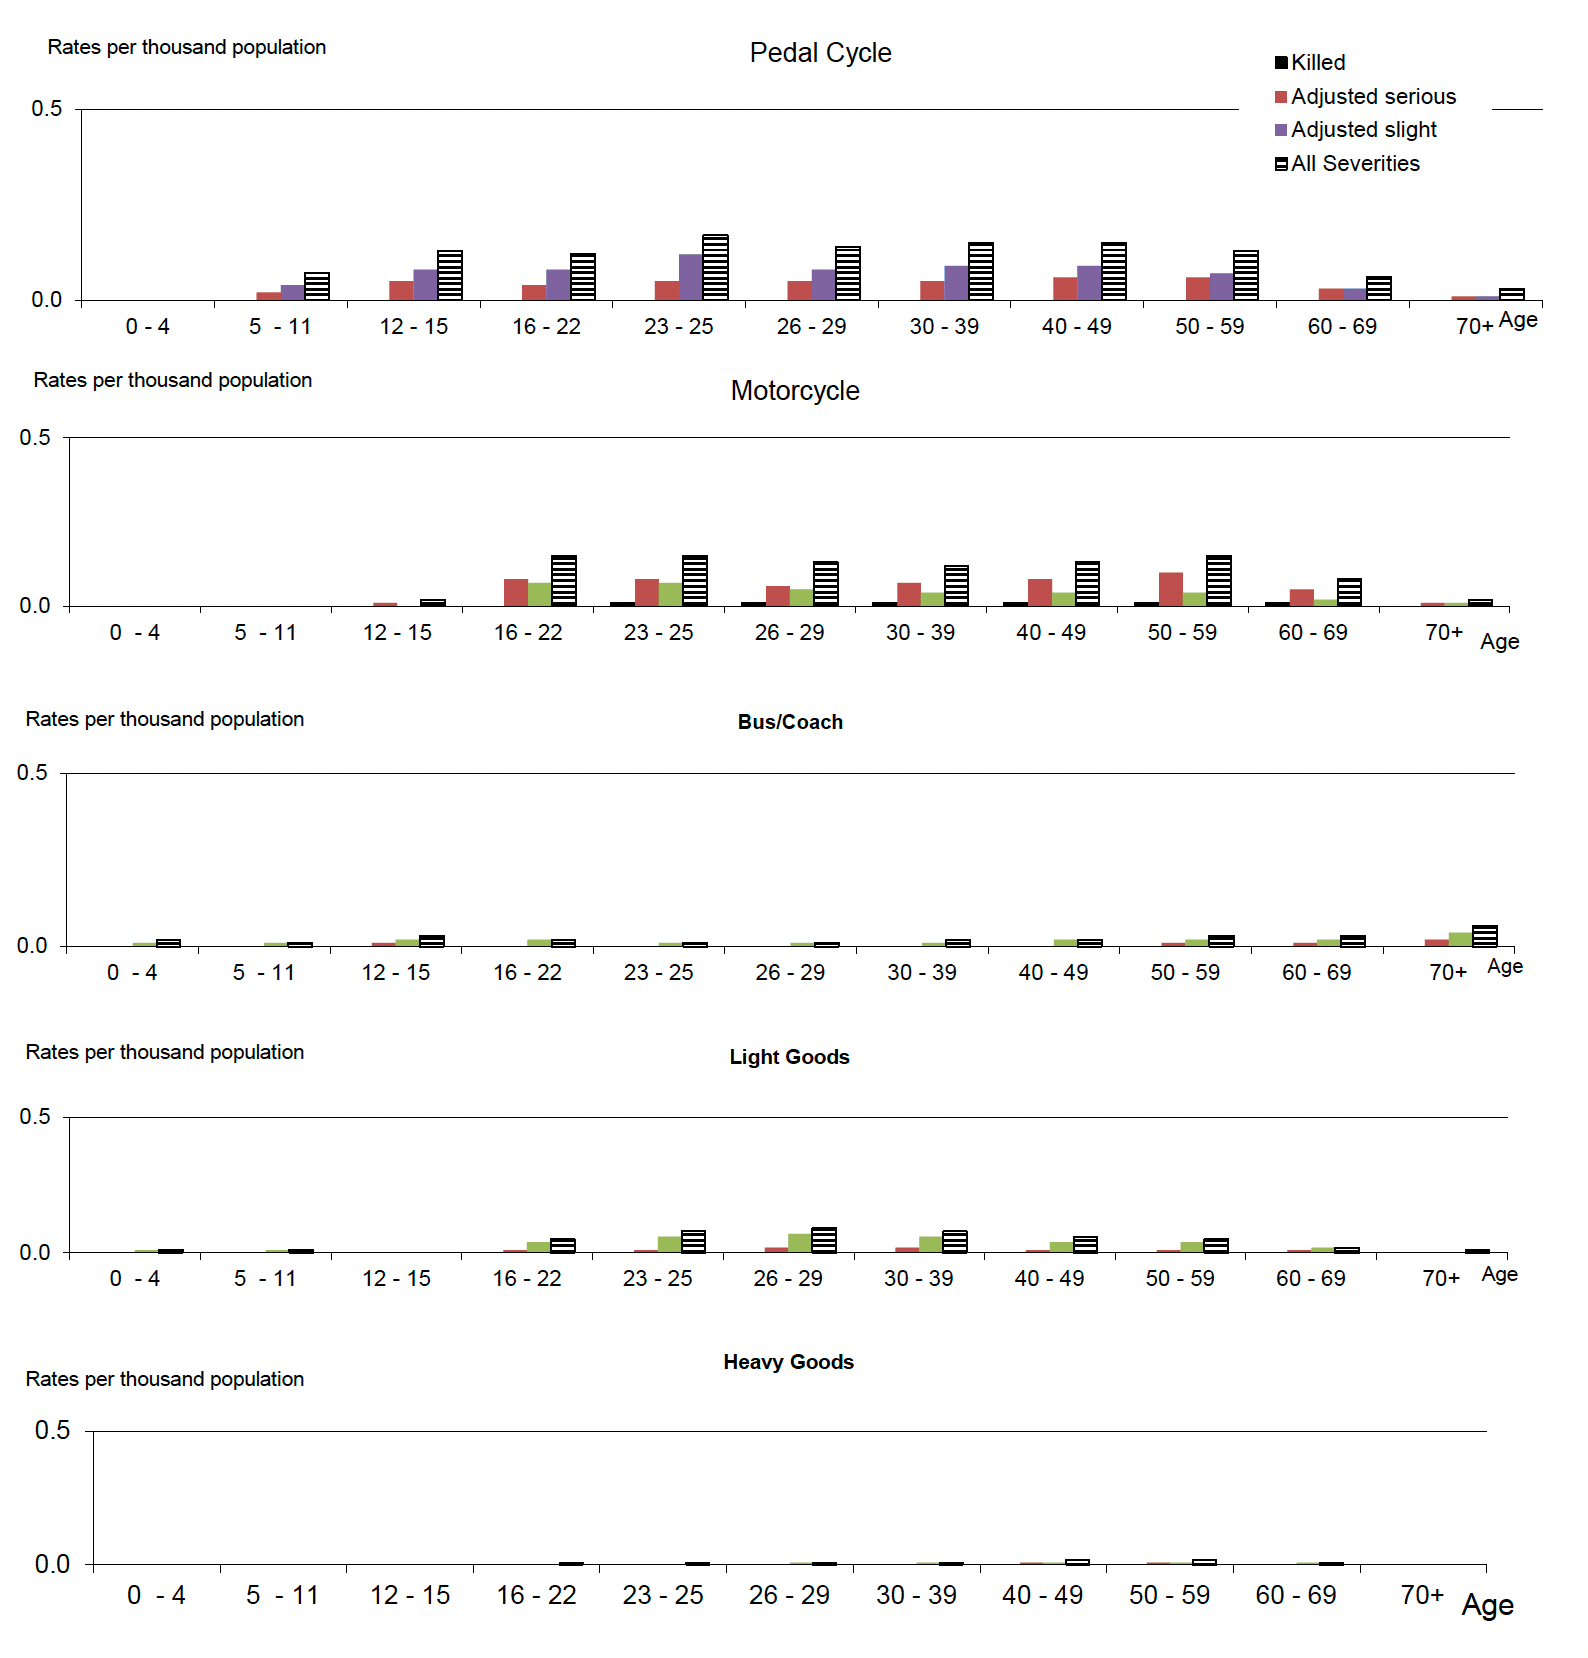
| Pedal Cycle | 0 - 4 | - | - | 1 | 1 | - | - | - | - |
| 5 - 11 | - | 9 | 18 | 28 | - | 0 | 0 | 0.07 | |
| 12 - 15 | - | 12 | 19 | 31 | - | 0 | 0 | 0.13 | |
| 16 - 22 | - | 16 | 36 | 52 | - | 0 | 0 | 0.12 | |
| 23-25 | - | 11 | 26 | 37 | - | 0 | 0 | 0.17 | |
| 26-29 | - | 16 | 26 | 42 | - | 0 | 0 | 0.14 | |
| 30 - 39 | 2 | 40 | 65 | 107 | - | 0 | 0 | 0.15 | |
| 40 - 49 | 1 | 42 | 59 | 104 | - | 0 | 0 | 0.15 | |
| 50 - 59 | 1 | 47 | 54 | 103 | - | 0 | 0 | 0.13 | |
| 60 - 69 | 1 | 18 | 20 | 40 | - | 0 | 0 | 0.06 | |
| 70 & over | 2 | 10 | 7 | 20 | - | 0 | 0 | 0.03 | |
| Total 1 | 8 | 222 | 330 | 566 | - | 0 | 0 | 0.10 | |
| Child 0-15 | - | 22 | 37 | 60 | - | 0 | 0 | 0.07 | |
| Adult 16+ | 7 | 200 | 292 | 505 | - | 0 | 0 | 0.11 | |
| Motorcycle 2 | 0 - 4 | - | - | - | - | - | - | - | - |
| 5 - 11 | - | - | - | - | - | - | - | - | |
| 12 - 15 | - | 3 | 1 | 4 | - | 0 | - | 0.02 | |
| 16 - 22 | 1 | 33 | 31 | 65 | - | 0 | 0 | 0.15 | |
| 23-25 | 1 | 17 | 15 | 33 | 0.01 | 0 | 0 | 0.15 | |
| 26-29 | 2 | 20 | 16 | 38 | 0.01 | 0 | 0 | 0.13 | |
| 30 - 39 | 4 | 54 | 33 | 90 | 0.01 | 0 | 0 | 0.12 | |
| 40 - 49 | 4 | 53 | 29 | 86 | 0.01 | 0 | 0 | 0.13 | |
| 50 - 59 | 8 | 77 | 32 | 117 | 0.01 | 0 | 0 | 0.15 | |
| 60 - 69 | 4 | 35 | 15 | 54 | 0.01 | 0 | 0 | 0.08 | |
| 70 & over | 1 | 7 | 4 | 12 | - | 0 | 0 | 0.02 | |
| Total 1 | 26 | 298 | 175 | 501 | - | 0 | 0 | 0.09 | |
| Child 0-15 | - | 3 | 1 | 4 | - | - | - | - | |
| Adult 16+ | 26 | 295 | 173 | 496 | 0.01 | 0 | 0 | 0.11 | |
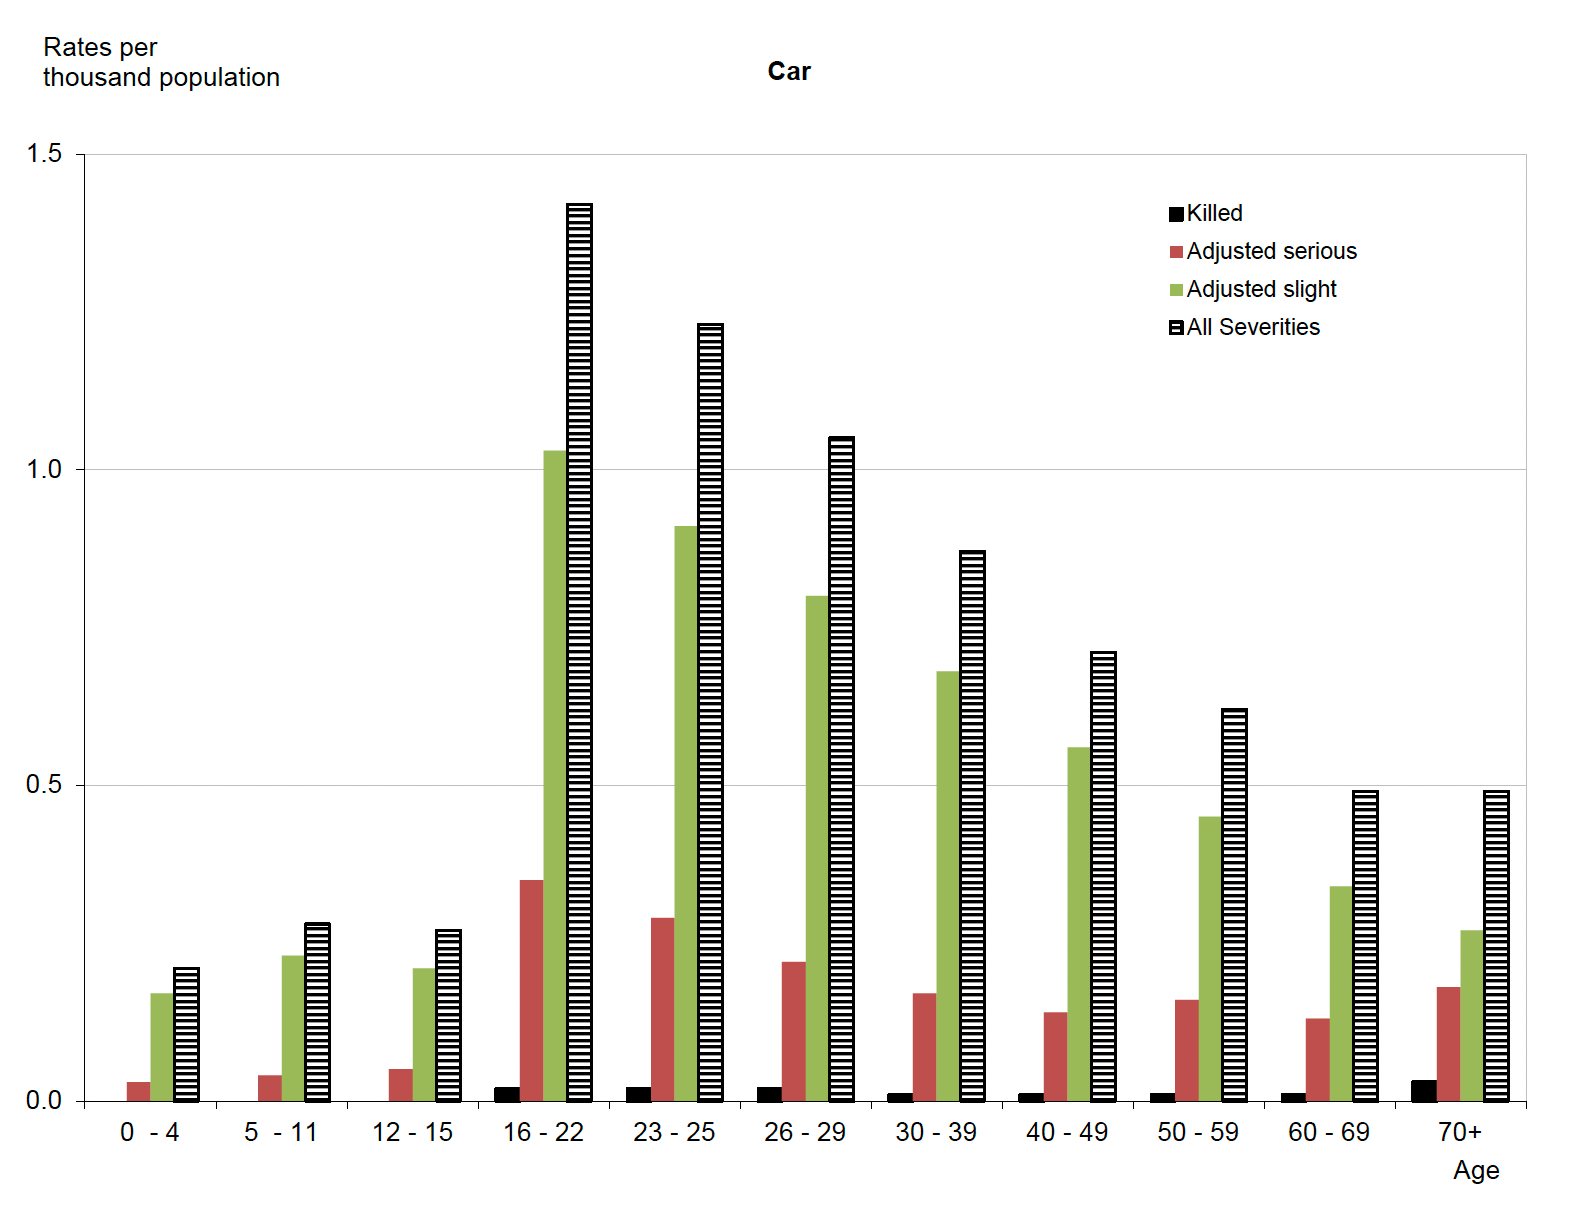
| Car | 0 - 4 | 1 | 9 | 46 | 56 | - | 0 | 0 | 0.21 |
| 5 - 11 | - | 17 | 97 | 115 | - | 0 | 0 | 0.28 | |
| 12 - 15 | - | 12 | 49 | 62 | - | 0 | 0 | 0.27 | |
| 16 - 22 | 9 | 150 | 438 | 602 | 0.02 | 0 | 1 | 1.42 | |
| 23-25 | 5 | 62 | 196 | 264 | 0.02 | 0 | 1 | 1.23 | |
| 26-29 | 5 | 67 | 244 | 318 | 0.02 | 0 | 1 | 1.05 | |
| 30 - 39 | 10 | 125 | 498 | 637 | 0.01 | 0 | 1 | 0.87 | |
| 40 - 49 | 7 | 95 | 379 | 484 | 0.01 | 0 | 1 | 0.71 | |
| 50 - 59 | 7 | 124 | 354 | 487 | 0.01 | 0 | 0 | 0.62 | |
| 60 - 69 | 10 | 87 | 220 | 319 | 0.01 | 0 | 0 | 0.49 | |
| 70 & over | 23 | 137 | 205 | 368 | 0.03 | 0 | 0 | 0.49 | |
| Total 1 | 75 | 885 | 2,731 | 3,718 | 0.01 | 0 | 1 | 0.68 | |
| Child 0-15 | 1 | 38 | 193 | 234 | - | 0 | 0 | 0.26 | |
| Adult 16+ | 74 | 847 | 2,534 | 3,479 | 0.02 | 0 | 1 | 0.76 | |
1. Includes those whose age was 'not known'
2. Motorcycle includes all two wheeled motor vehicles
3. Mid-year population estimates for 2022 were not available, estimates for 2021 used instead.
Table 32 (continued): Population Estimates Reported casualties by age and severity, separately for each mode of transport
Numbers and rates per thousand population
| Road User | Age group | Killed | Adjusted serious | Adjusted slight | All Severities | Killed | Adjusted serious | Adjusted slight | All Severities |
|---|---|---|---|---|---|---|---|---|---|
| numbers | rates per thousand population | ||||||||
| Taxi | 0 - 4 | - | - | - | 1 | - | - | - | - |
| 5 - 11 | - | - | 1 | 1 | - | - | - | - | |
| 12 - 15 | - | - | 3 | 3 | - | - | 0 | 0.01 | |
| 16 - 22 | - | 1 | 6 | 7 | - | - | 0 | 0.02 | |
| 23-25 | - | - | 4 | 4 | - | - | 0 | 0.02 | |
| 26-29 | - | - | 4 | 4 | - | - | 0 | 0.01 | |
| 30 - 39 | - | 2 | 14 | 17 | - | - | 0 | 0.02 | |
| 40 - 49 | - | 2 | 13 | 16 | - | - | 0 | 0.02 | |
| 50 - 59 | - | 4 | 14 | 19 | - | 0 | 0 | 0.02 | |
| 60 - 69 | - | 3 | 9 | 13 | - | - | 0 | 0.02 | |
| 70 & over | - | 1 | 4 | 6 | - | - | 0 | 0.01 | |
| Total 1 | 1 | 15 | 73 | 90 | - | - | 0 | 0.02 | |
| Child 0-15 | - | 1 | 4 | 5 | - | - | - | 0.01 | |
| Adult 16+ | 1 | 14 | 69 | 85 | - | - | 0 | 0.02 | |
| Minibus | 0 - 4 | - | - | - | 1 | - | - | - | - |
| 5 - 11 | - | - | 2 | 2 | - | - | - | - | |
| 12 - 15 | - | - | - | 1 | - | - | - | - | |
| 16 - 22 | - | - | 1 | 1 | - | - | - | - | |
| 23-25 | - | - | - | - | - | - | - | - | |
| 26-29 | - | - | 1 | 1 | - | - | - | - | |
| 30 - 39 | - | 1 | 1 | 2 | - | - | - | - | |
| 40 - 49 | - | 1 | 2 | 4 | - | - | - | 0.01 | |
| 50 - 59 | - | 1 | 3 | 4 | - | - | - | - | |
| 60 - 69 | - | 1 | 2 | 3 | - | - | - | 0.01 | |
| 70 & over | - | - | - | 1 | - | - | - | - | |
| Total 1 | 1 | 5 | 13 | 19 | - | - | - | - | |
| Child 0-15 | - | - | 2 | 3 | - | - | - | - | |
| Adult 16+ | - | 5 | 10 | 16 | - | - | - | - | |
| Bus/Coach | 0 - 4 | - | - | 4 | 5 | - | - | 0 | 0.02 |
| 5 - 11 | - | 1 | 5 | 6 | - | - | 0 | 0.01 | |
| 12 - 15 | - | 1 | 5 | 6 | - | 0 | 0 | 0.03 | |
| 16 - 22 | - | 2 | 7 | 8 | - | - | 0 | 0.02 | |
| 23-25 | - | 1 | 3 | 3 | - | - | 0 | 0.01 | |
| 26-29 | - | 1 | 3 | 4 | - | - | 0 | 0.01 | |
| 30 - 39 | - | 2 | 10 | 11 | - | - | 0 | 0.02 | |
| 40 - 49 | - | 2 | 11 | 14 | - | - | 0 | 0.02 | |
| 50 - 59 | - | 6 | 17 | 23 | - | 0 | 0 | 0.03 | |
| 60 - 69 | - | 5 | 15 | 20 | - | 0 | 0 | 0.03 | |
| 70 & over | 1 | 12 | 28 | 42 | - | 0 | 0 | 0.06 | |
| Total 1 | 1 | 32 | 107 | 142 | - | 0 | 0 | 0.03 | |
| Child 0-15 | - | 2 | 14 | 17 | - | - | 0 | 0.02 | |
| Adult 16+ | 1 | 30 | 93 | 125 | - | 0 | 0 | 0.03 | |
| Light goods | 0 - 4 | - | - | 1 | 2 | - | - | 0 | 0.01 |
| 5 - 11 | - | - | 3 | 3 | - | - | 0 | 0.01 | |
| 12 - 15 | - | - | - | - | - | - | - | - | |
| 16 - 22 | - | 4 | 16 | 20 | - | 0 | 0 | 0.05 | |
| 23-25 | - | 3 | 13 | 16 | - | 0 | 0 | 0.08 | |
| 26-29 | - | 6 | 20 | 27 | - | 0 | 0 | 0.09 | |
| 30 - 39 | 1 | 13 | 44 | 58 | - | 0 | 0 | 0.08 | |
| 40 - 49 | - | 10 | 29 | 39 | - | 0 | 0 | 0.06 | |
| 50 - 59 | 1 | 9 | 28 | 38 | - | 0 | 0 | 0.05 | |
| 60 - 69 | 1 | 5 | 10 | 16 | - | 0 | 0 | 0.02 | |
| 70 & over | - | 2 | 2 | 4 | - | - | - | 0.01 | |
| Total 1 | 4 | 51 | 167 | 223 | - | 0 | 0 | 0.04 | |
| Child 0-15 | - | - | 4 | 5 | - | - | - | 0.01 | |
| Adult 16+ | 4 | 50 | 163 | 218 | - | 0 | 0 | 0.05 | |
1. Includes those whose age was 'not known'
2. Mid-year population estimates for 2022 were not available, estimates for 2021 used instead.
Table 32 (continued): Population Estimates Reported casualties by age and severity, separately for each mode of transport
Numbers and rates per thousand population
| Road User | Age group | Killed | Adjusted serious | Adjusted slight | All Severities | Killed | Adjusted serious | Adjusted slight | All Severities |
|---|---|---|---|---|---|---|---|---|---|
| numbers | rates per thousand population | ||||||||
| Heavy goods | 0 - 4 | - | - | - | - | - | - | - | - |
| 5 - 11 | - | - | - | - | - | - | - | - | |
| 12 - 15 | - | - | - | - | - | - | - | - | |
| 16 - 22 | - | 1 | 1 | 2 | - | - | - | 0.01 | |
| 23-25 | - | 1 | - | 1 | - | - | - | 0.01 | |
| 26-29 | - | 1 | 2 | 3 | - | - | 0 | 0.01 | |
| 30 - 39 | - | 2 | 6 | 8 | - | - | 0 | 0.01 | |
| 40 - 49 | - | 3 | 8 | 12 | - | 0 | 0 | 0.02 | |
| 50 - 59 | 1 | 5 | 10 | 16 | - | 0 | 0 | 0.02 | |
| 60 - 69 | - | 2 | 4 | 7 | - | - | 0 | 0.01 | |
| 70 & over | - | - | - | 1 | - | - | - | - | |
| Total 1 | 2 | 16 | 31 | 50 | - | - | 0 | 0.01 | |
| Child 0-15 | - | - | 1 | 1 | - | - | - | - | |
| Adult 16+ | 2 | 16 | 31 | 50 | - | - | 0 | 0.01 | |
| Other | 0 - 4 | - | - | - | - | - | - | - | - |
| 5 - 11 | - | 1 | 1 | 3 | - | - | - | 0.01 | |
| 12 - 15 | - | 2 | 1 | 3 | - | 0 | - | 0.01 | |
| 16 - 22 | - | 3 | 5 | 8 | - | 0 | 0 | 0.02 | |
| 23-25 | - | 1 | 2 | 3 | - | - | 0 | 0.02 | |
| 26-29 | - | 2 | 3 | 5 | - | 0 | 0 | 0.02 | |
| 30 - 39 | - | 6 | 10 | 16 | - | 0 | 0 | 0.02 | |
| 40 - 49 | - | 3 | 7 | 11 | - | - | 0 | 0.02 | |
| 50 - 59 | - | 4 | 10 | 14 | - | - | 0 | 0.02 | |
| 60 - 69 | - | 2 | 4 | 6 | - | - | 0 | 0.01 | |
| 70 & over | 1 | 3 | 2 | 6 | - | - | - | 0.01 | |
| Total 1 | 2 | 27 | 45 | 75 | - | - | 0 | 0.01 | |
| Child 0-15 | - | 3 | 2 | 6 | - | - | - | 0.01 | |
| Adult 16+ | 2 | 24 | 42 | 69 | - | 0 | 0 | 0.02 | |
| Total | 0 - 4 | 2 | 20 | 69 | 91 | 0.01 | 0 | 0 | 0.35 |
| 5 - 11 | - | 80 | 207 | 290 | - | 0 | 1 | 0.69 | |
| 12 - 15 | 2 | 85 | 149 | 238 | 0.01 | 0 | 1 | 1.02 | |
| 16 - 22 | 13 | 246 | 597 | 864 | 0.03 | 1 | 1 | 2.03 | |
| 23-25 | 8 | 108 | 278 | 396 | 0.04 | 1 | 1 | 1.85 | |
| 26-29 | 9 | 130 | 343 | 486 | 0.03 | 0 | 1 | 1.60 | |
| 30 - 39 | 22 | 290 | 741 | 1,060 | 0.03 | 0 | 1 | 1.45 | |
| 40 - 49 | 18 | 250 | 590 | 866 | 0.03 | 0 | 1 | 1.28 | |
| 50 - 59 | 24 | 325 | 578 | 934 | 0.03 | 0 | 1 | 1.18 | |
| 60 - 69 | 23 | 201 | 338 | 566 | 0.03 | 0 | 1 | 0.87 | |
| 70 & over | 37 | 238 | 305 | 586 | 0.05 | 0 | 0 | 0.78 | |
| Total 1 | 156 | 1,974 | 4,204 | 6,386 | 0.03 | 0 | 1 | 1.17 | |
| Child 0-15 | 4 | 186 | 426 | 620 | - | 0 | 0 | 0.68 | |
| Adult 16+ | 152 | 1,787 | 3,771 | 5,757 | 0.03 | 0 | 1 | 1.27 | |
1. Includes those whose age was 'not known'
2. Mid-year population estimates for 2022 were not available, estimates for 2021 used instead.
Table 32
Reported casualty rates per thousand population by mode of transport, age group and severity
Years: 2018-2022 average 1
< Previous | Contents | Next >