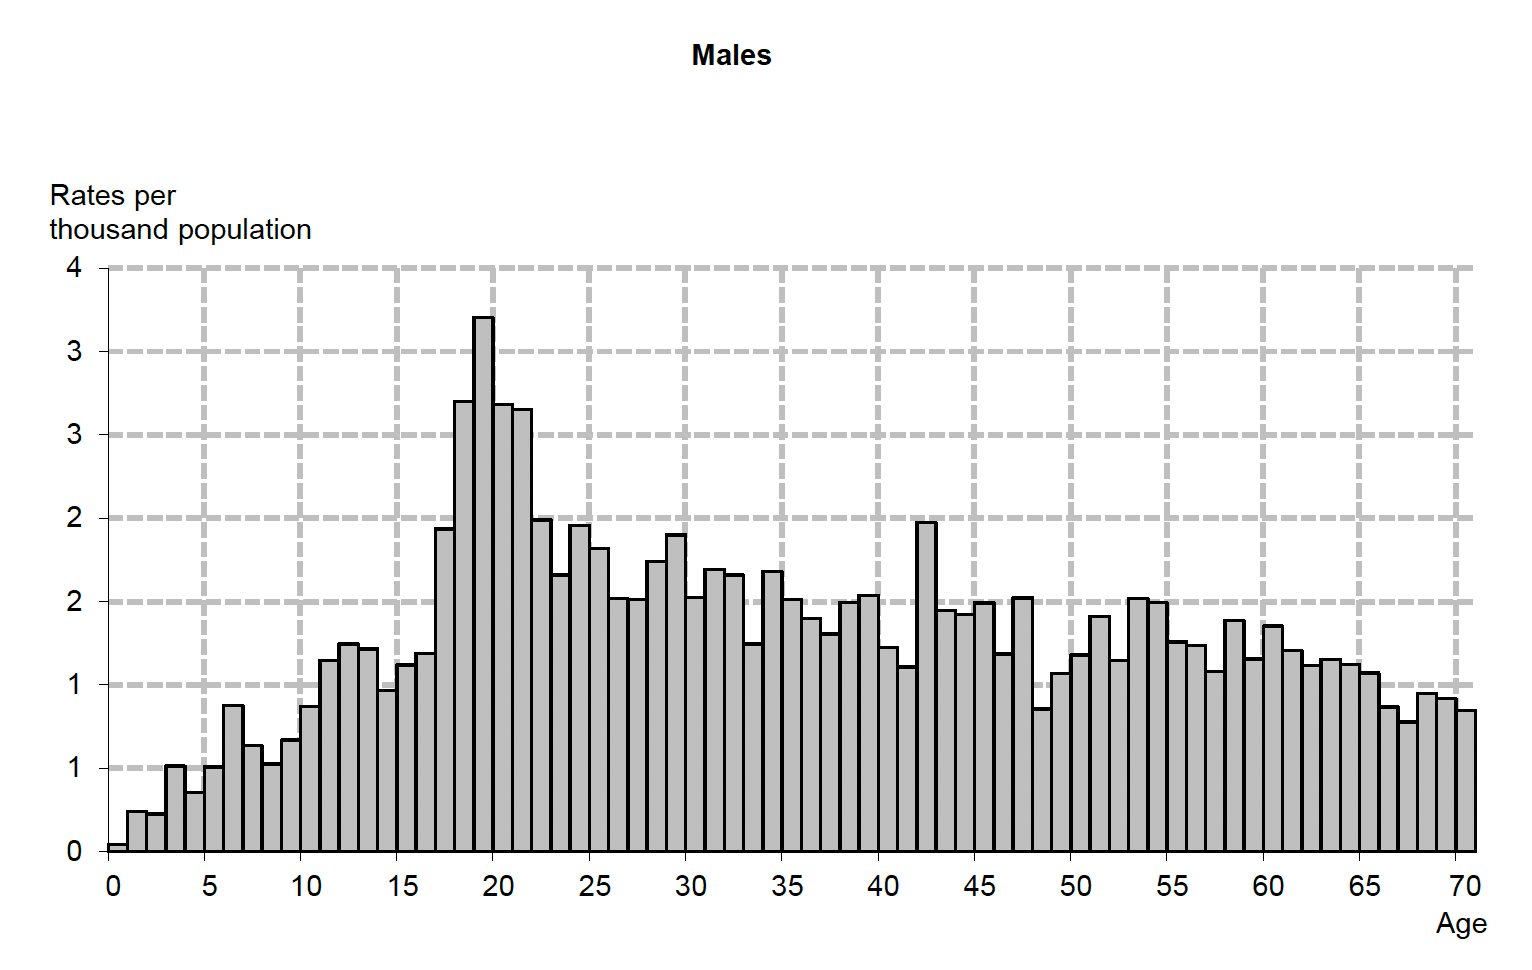
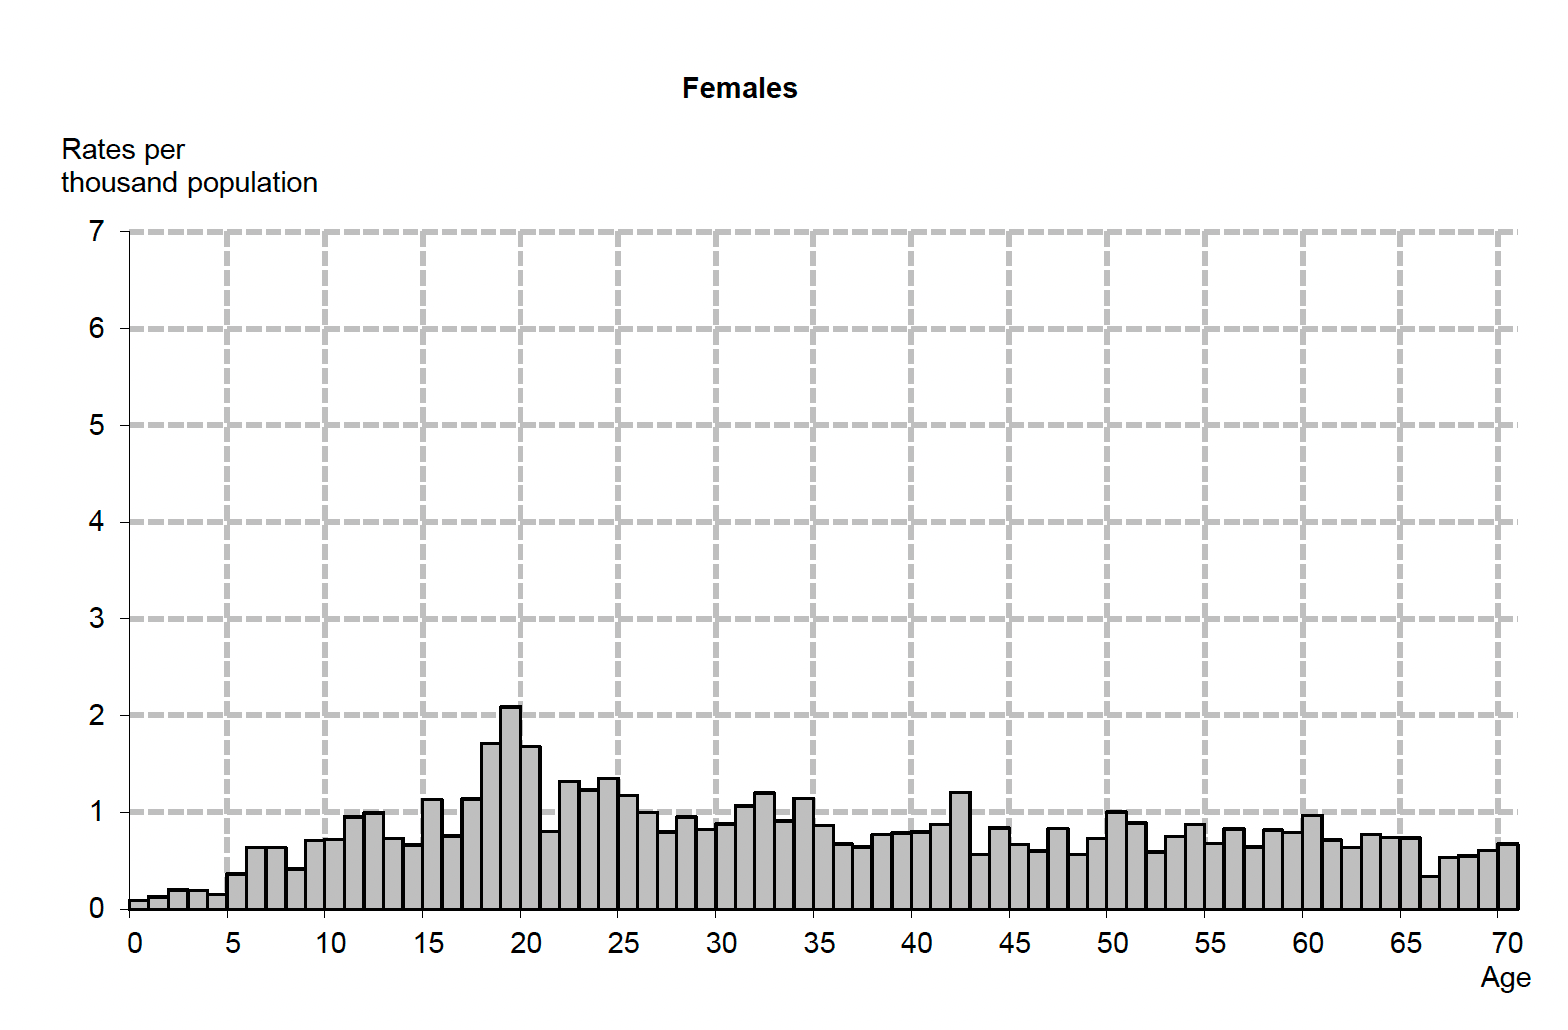
Table 31: Population estimates, number of reported casualties and casualty rates per thousand population by age groups
Table 31: Population estimates, number of reported casualties and casualty rates per thousand population by age groups
| Year | 0-4 | 5-11 | 12-15 | 16-22 | 23-29 | 30-39 | 40-49 | 50-59 | 60-69 | 70+ | All Ages 1 |
|---|---|---|---|---|---|---|---|---|---|---|---|
| Population | thousands | ||||||||||
| 2014-18 average | 285.8 | 409.6 | 219.8 | 453.2 | 521.9 | 681.9 | 728.4 | 775.2 | 632.2 | 689.5 | 5,397.6 |
| 2018 | 276.9 | 419.9 | 222.7 | 437.3 | 526.5 | 709.3 | 691.8 | 791.3 | 636.7 | 725.7 | 5,438.1 |
| 2019 | 271.7 | 421.3 | 228.4 | 430.7 | 525.3 | 722.0 | 680.9 | 794.2 | 644.1 | 744.7 | 5,463.3 |
| 2020 | 263.8 | 418.8 | 234.1 | 423.8 | 520.3 | 729.7 | 674.3 | 792.5 | 653.0 | 755.6 | 5,466.0 |
| 2021 | 255.4 | 416.5 | 239.5 | 417.0 | 511.6 | 743.3 | 670.8 | 791.2 | 666.1 | 768.4 | 5,479.9 |
| 2022 3 | 255.4 | 416.5 | 239.5 | 417.0 | 511.6 | 743.3 | 670.8 | 791.2 | 666.1 | 768.4 | 5,479.9 |
| 2018-2022. average 3 | 264.7 | 418.6 | 232.9 | 425.1 | 519.0 | 729.5 | 677.7 | 792.1 | 653.2 | 752.6 | 5,465.4 |
| Casualties | number | ||||||||||
| 2014-18 average | 140 | 441 | 350 | 1,535 | 1,474 | 1,627 | 1,589 | 1,415 | 800 | 817 | 10,207 |
| 2018 | 125 | 348 | 281 | 1,100 | 1,180 | 1,415 | 1,219 | 1,212 | 747 | 770 | 8,424 |
| 2019 | 125 | 354 | 290 | 1,007 | 1,040 | 1,249 | 1,023 | 1,164 | 670 | 770 | 7,706 |
| 2020 | 85 | 226 | 182 | 734 | 772 | 888 | 688 | 724 | 403 | 360 | 5,062 |
| 2021 | 66 | 232 | 197 | 706 | 709 | 856 | 702 | 759 | 436 | 451 | 5,115 |
| 2022 | 56 | 289 | 242 | 773 | 710 | 890 | 697 | 812 | 574 | 577 | 5,621 |
| 2018-2022. average | 91 | 290 | 238 | 864 | 882 | 1,060 | 866 | 934 | 566 | 586 | 6,386 |
| 2022 Male | 37 | 160 | 139 | 496 | 446 | 553 | 434 | 490 | 343 | 286 | 3,384 |
| 2022 Female | 19 | 129 | 103 | 276 | 264 | 337 | 263 | 322 | 231 | 290 | 2,235 |
| Casualty rates | rates per thousand population | ||||||||||
| 2014-18 average | 0.49 | 1.08 | 1.59 | 3.39 | 2.82 | 2.39 | 2.18 | 1.83 | 1.27 | 1.18 | 1.89 |
| 2018 | 0.45 | 0.83 | 1.26 | 2.52 | 2.24 | 2 | 1.76 | 1.53 | 1.17 | 1.06 | 1.55 |
| 2019 | 0.46 | 0.84 | 1.27 | 2.34 | 1.98 | 1.73 | 1.5 | 1.47 | 1.04 | 1.03 | 1.41 |
| 2020 | 0.32 | 0.54 | 0.78 | 1.73 | 1.48 | 1.22 | 1.02 | 0.91 | 0.62 | 0.48 | 0.92 |
| 2021 | 0.26 | 0.56 | 0.82 | 1.69 | 1.38 | 1.15 | 1.04 | 0.96 | 0.65 | 0.58 | 0.93 |
| 2022 3 | 0.22 | 0.69 | 1.01 | 1.85 | 1.39 | 1.2 | 1.04 | 1.03 | 0.86 | 0.75 | 1.03 |
| 2018-2022. average 3 | 0.35 | 0.69 | 1.02 | 2.03 | 1.7 | 1.45 | 1.28 | 1.18 | 0.87 | 0.78 | 1.17 |
| Male | |||||||||||
| 2014-18 average | 1.03 | 2.65 | 4.13 | 8.89 | 5.15 | 5.18 | 4.25 | 2.44 | 1.69 | 1.58 | 3.70 |
| 2018 | 0.50 | 0.97 | 1.31 | 2.74 | 2.6 | 2.48 | 2.19 | 1.89 | 1.30 | 1.21 | 1.83 |
| 2019 | 0.43 | 0.97 | 1.33 | 2.59 | 2.17 | 2.11 | 1.85 | 1.77 | 1.18 | 1.12 | 1.63 |
| 2020 | 0.31 | 0.56 | 0.94 | 2.06 | 1.78 | 1.6 | 1.3 | 1.2 | 0.78 | 0.62 | 1.16 |
| 2021 | 0.30 | 0.63 | 0.97 | 1.92 | 1.68 | 1.49 | 1.36 | 1.28 | 0.76 | 0.67 | 1.16 |
| 2022 3 | 0.28 | 0.75 | 1.14 | 2.33 | 1.73 | 1.51 | 1.32 | 1.29 | 1.07 | 0.85 | 1.27 |
| 2018-2022. average 3 | 0.37 | 0.77 | 1.14 | 2.33 | 2.00 | 1.83 | 1.61 | 1.49 | 1.02 | 0.89 | 1.41 |
| Female | |||||||||||
| 2014-18 average | 0.78 | 1.80 | 3.50 | 6.22 | 3.58 | 3.52 | 2.82 | 1.95 | 1.57 | 1.58 | 2.66 |
| 2018 | 0.35 | 0.69 | 1.21 | 2.28 | 1.88 | 1.53 | 1.36 | 1.2 | 1.05 | 0.95 | 1.28 |
| 2019 | 0.46 | 0.71 | 1.2 | 2.07 | 1.79 | 1.37 | 1.17 | 1.18 | 0.91 | 0.97 | 1.20 |
| 2020 | 0.34 | 0.51 | 0.61 | 1.39 | 1.18 | 0.84 | 0.75 | 0.65 | 0.47 | 0.36 | 0.70 |
| 2021 | 0.21 | 0.48 | 0.66 | 1.45 | 1.08 | 0.82 | 0.74 | 0.66 | 0.56 | 0.52 | 0.72 |
| 2022 3 | 0.15 | 0.64 | 0.88 | 1.35 | 1.04 | 0.90 | 0.77 | 0.78 | 0.67 | 0.67 | 0.80 |
| 2018-2022. average 3 | 0.30 | 0.61 | 0.91 | 1.72 | 1.40 | 1.09 | 0.96 | 0.89 | 0.73 | 0.69 | 0.94 |
1. Includes those whose ages were 'not known'.
2. Minor revisions have been made to the population estimates for indvidual age groups. Overall estimates for Scotland are unchanged.
3. Mid-year population estimates for 2022 were not available, estimates for 2021 used instead.
Table 31: Reported casualty rates per thousand population, by age and sex
Year: 2022


< Previous | Contents | Next >