Table 27: Reported child 1 casualties by time of day and mode of transport: Separately for weekdays/weekends: Years: 2018-2022 average
Table 27: Reported child 1 casualties by time of day and mode of transport: Separately for weekdays/weekends: Years: 2018-2022 average
| Day/hour | Pedestrian | Pedal cycle | Motor cycle2 | Car | Taxi | Minibus | Bus/ coach | Light goods | Heavy goods | Other | Total |
|---|---|---|---|---|---|---|---|---|---|---|---|
| Total for Weekdays | |||||||||||
| 00.00 to 00.59 | - | - | - | 1 | - | - | - | - | - | - | 1 |
| 01.00 to 01.59 | - | - | - | 1 | - | - | - | 0 | - | - | 1 |
| 02.00 to 02.59 | - | - | - | 1 | - | - | - | - | 0 | - | 1 |
| 03.00 to 03.59 | - | - | - | - | - | - | - | - | - | - | - |
| 04.00 to 04.59 | - | - | - | - | - | - | - | 0 | - | - | 0 |
| 05.00 to 05.59 | - | - | - | 0 | - | - | - | - | - | - | 0 |
| 06.00 to 06.59 | 0 | 0 | - | 0 | - | - | - | - | - | - | 1 |
| 07.00 to 07.59 | 3 | 0 | - | 2 | - | - | - | 0 | - | - | 6 |
| 08.00 to 08.59 | 25 | 6 | - | 10 | 0 | 1 | 4 | 0 | - | 0 | 46 |
| 09.00 to 09.59 | 7 | 0 | - | 6 | - | - | 0 | 1 | - | - | 13 |
| 10.00 to 10.59 | 3 | - | - | 5 | - | - | 0 | 0 | - | - | 8 |
| 11.00 to 11.59 | 2 | 0 | 0 | 8 | - | - | 0 | - | - | - | 11 |
| 12.00 to 12.59 | 11 | 2 | - | 8 | - | - | 1 | - | - | - | 22 |
| 13.00 to 13.59 | 17 | 2 | 0 | 10 | 2 | - | 0 | - | - | 0 | 32 |
| 14.00 to 14.59 | 11 | 3 | - | 10 | 0 | - | 2 | 0 | 0 | 0 | 26 |
| 15.00 to 15.59 | 52 | 7 | 0 | 21 | 0 | 0 | 1 | - | - | 0 | 83 |
| 16.00 to 16.59 | 34 | 6 | 0 | 17 | 0 | 1 | 1 | 0 | - | 0 | 59 |
| 17.00 to 17.59 | 28 | 7 | - | 19 | 0 | 0 | 1 | - | - | 0 | 56 |
| 18.00 to 18.59 | 19 | 5 | 0 | 10 | 0 | - | 0 | 1 | - | - | 36 |
| 19.00 to 19.59 | 11 | 3 | 0 | 11 | - | - | 0 | - | - | 1 | 27 |
| 20.00 to 20.59 | 7 | 2 | 0 | 8 | - | - | 0 | - | - | - | 18 |
| 21.00 to 21.59 | 3 | 1 | 1 | 5 | - | - | - | - | - | - | 10 |
| 22.00 to 22.59 | 1 | 1 | - | 4 | - | - | - | - | - | 0 | 6 |
| 23.00 to 23.59 | 0 | - | 0 | 1 | - | 0 | - | - | - | - | 2 |
| Total | 233 | 46 | 3 | 157 | 4 | 2 | 12 | 3 | 0 | 3 | 465 |
| Total for Weekends | |||||||||||
| 00.00 to 00.59 | 0 | - | - | 0 | - | - | - | 0 | - | - | 1 |
| 01.00 to 01.59 | 0 | - | - | 0 | - | - | - | - | - | - | 1 |
| 02.00 to 02.59 | 0 | - | - | 0 | - | - | - | - | - | 0 | 1 |
| 03.00 to 03.59 | 0 | - | - | - | - | - | - | - | - | - | 0 |
| 04.00 to 04.59 | - | - | - | 0 | - | - | - | - | - | - | 0 |
| 05.00 to 05.59 | - | - | - | 1 | - | - | - | - | - | - | 1 |
| 06.00 to 06.59 | - | 0 | - | - | - | - | - | - | - | - | 0 |
| 07.00 to 07.59 | - | - | - | - | - | - | - | - | 0 | - | 0 |
| 08.00 to 08.59 | - | 0 | - | 1 | - | - | - | 0 | - | - | 1 |
| 09.00 to 09.59 | 1 | 0 | - | 2 | - | - | - | - | - | - | 3 |
| 10.00 to 10.59 | 1 | - | - | 4 | - | - | 0 | 0 | - | - | 6 |
| 11.00 to 11.59 | 2 | 1 | - | 4 | - | - | 0 | 0 | - | - | 7 |
| 12.00 to 12.59 | 3 | 1 | - | 6 | - | 0 | 1 | - | - | 1 | 11 |
| 13.00 to 13.59 | 5 | 1 | 0 | 9 | 0 | - | 0 | 0 | - | 0 | 15 |
| 14.00 to 14.59 | 5 | 2 | 0 | 9 | - | 0 | 1 | - | - | - | 16 |
| 15.00 to 15.59 | 6 | 3 | 0 | 8 | - | - | 1 | - | - | 0 | 18 |
| 16.00 to 16.59 | 5 | 1 | - | 8 | - | - | - | - | - | 1 | 14 |
| 17.00 to 17.59 | 6 | 2 | - | 7 | - | 0 | 0 | 0 | - | - | 17 |
| 18.00 to 18.59 | 5 | 1 | - | 6 | - | - | 0 | 0 | - | - | 12 |
| 19.00 to 19.59 | 6 | 1 | - | 5 | 0 | - | 1 | - | - | - | 14 |
| 20.00 to 20.59 | 3 | 1 | 0 | 3 | - | - | 0 | - | - | - | 8 |
| 21.00 to 21.59 | 2 | 1 | - | 3 | - | - | - | - | - | - | 5 |
| 22.00 to 22.59 | 1 | - | - | 1 | - | - | - | - | - | - | 2 |
| 23.00 to 23.59 | 1 | - | - | 1 | - | - | - | - | - | - | 2 |
| Total | 53 | 15 | 1 | 76 | 1 | 1 | 4 | 2 | 0 | 2 | 155 |
1. Child 0-15 years
2. Motor cycle includes all two wheeled motor vehicles
''0' represents 0.1 to 0.4 and '-'=zero.
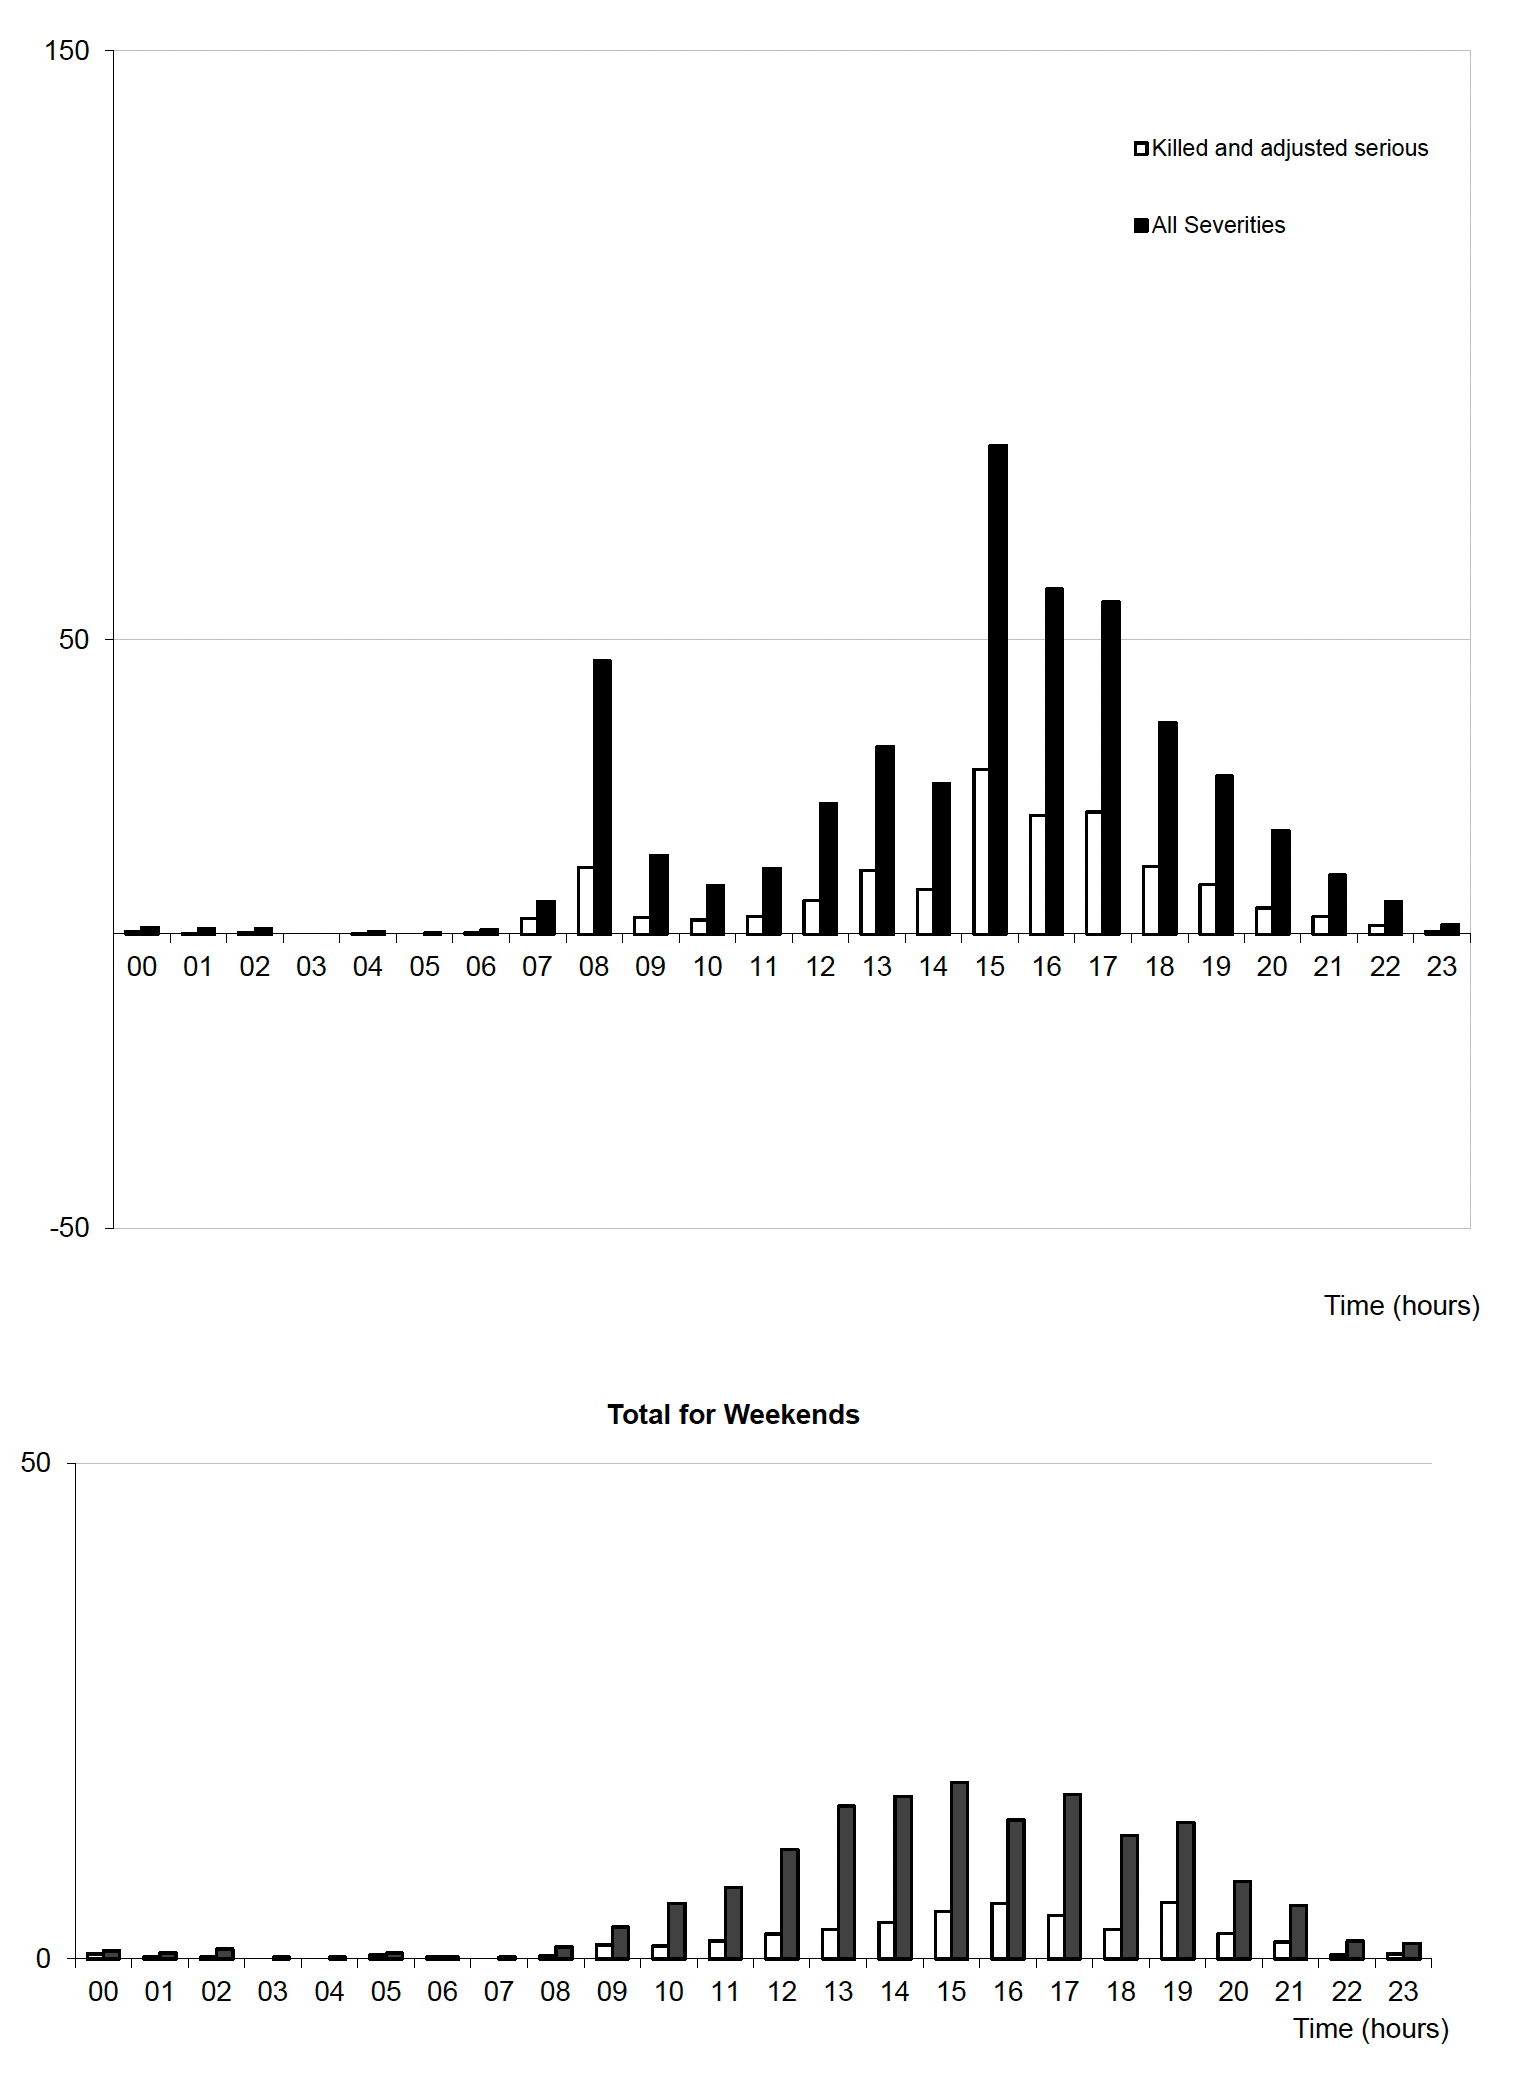
Table 27
Reported child casualties by time of day
Years: 2017 - 2021 average
< Previous | Contents | Next >