Figure 7: Reported casualties: 5 year moving average (1947-51 to 2018-22)
Figure 7: Reported casualties: 5 year moving average (1947-51 to 2018-22)
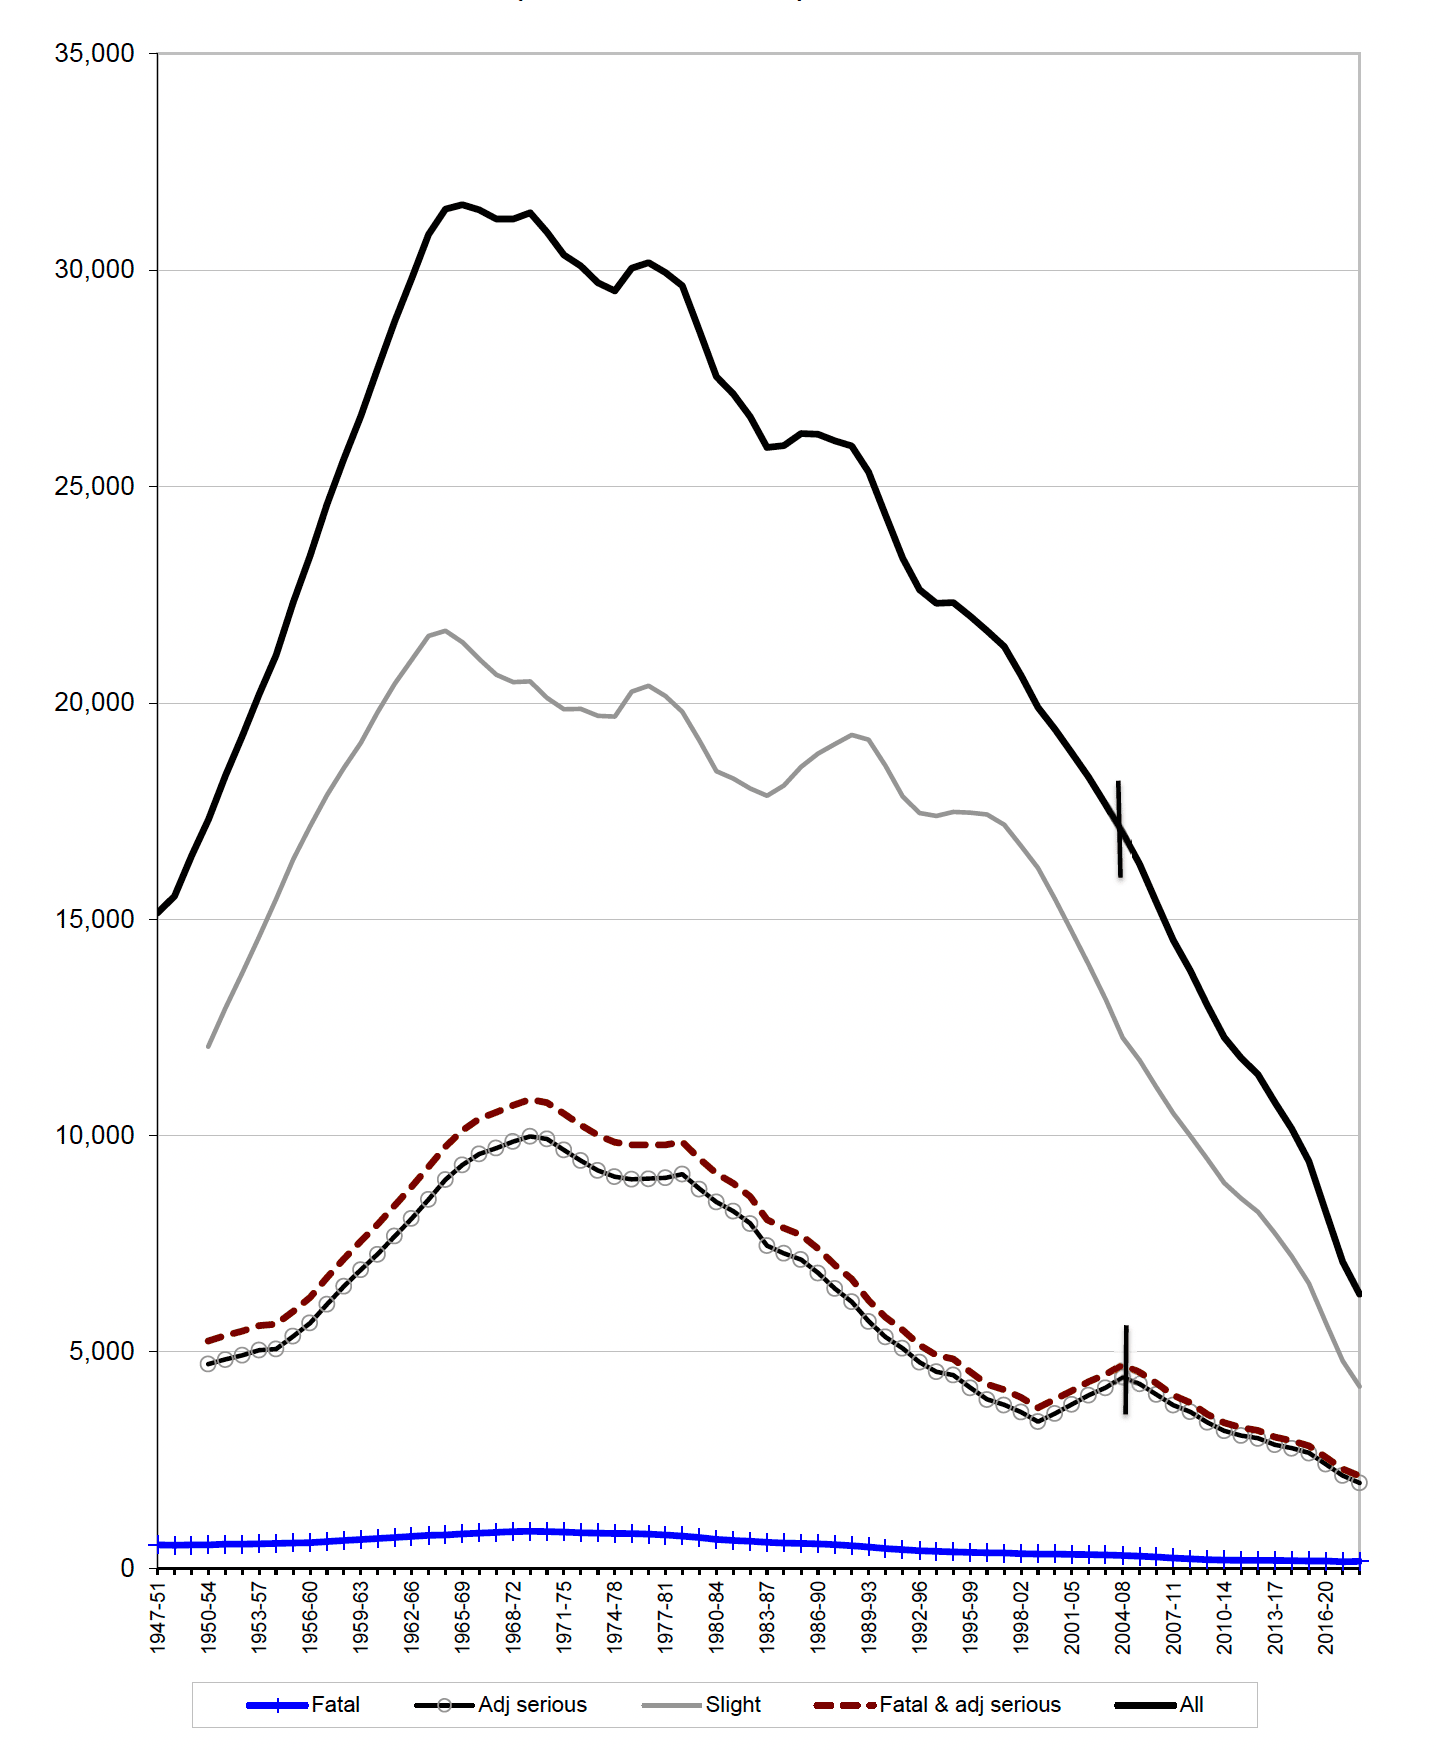
Due to changes in the the way casualty severities are recorded, serious and slight figures prior to 2004 are not comparable with previous years.
< Previous | Contents | Next >