Road Safety Context in Scotland
Scotland’s Road Safety Framework to 2030
Transport Scotland’s Road Safety Framework to 2030 sets out a long-term vision for road safety, Vision Zero, where there are zero fatalities and injuries on Scotland’s roads by 2050. As per the framework’s interim targets to 2030, four main casualty reduction targets have been outlined. These are identified in Table 2-1 below.
| Casualty Reduction Target | 2030 target % reduction |
|---|---|
| People killed | 50% |
| People seriously injured | 50% |
| Children (aged < 16) killed | 60% |
| Children (aged < 16) seriously injured | 60% |
Review of Casualty Data
In Reported Road Casualties Scotland 2022, the progress made towards the four reduction targets has been assessed by comparing the 2030 targets against a 2014-2018 yearly average, which is used as the baseline and against the 2022 data; as per Table 2-2 below.
| Target | 2014-2018 average | 2022 data | 2030 target |
|---|---|---|---|
| People killed | 174 | 173 | 87 |
| People seriously injured | 2771 | 1776 | 1454 |
| Children (aged < 16) killed | 6 | 5 | 2 |
| Children (aged < 16) seriously injured | 264 | 176 | 111 |
Key observations from the latest casualty figures of 2022 show that:
- 173 people were reported as killed in 2022, 0.3% below the 2014-2018 average of 174.
- 1,776 people were reported as seriously injured in 2022, 36% (995) below the 2014-2018 average of 2,771.
- 3 children were reported as killed in 2022, meaning the average for the 2020-2022 period was 5 per year, this is 17% below the 2014-2018 average of 6.
- 176 children were reported as seriously injured in 2022, 33% (88) below the 2014-2018 average of 264.
Table 5b of Reported Road Casualties Scotland 2022 identifies that local authority A roads in non-built up areas had the highest collision rates on Scotland’s roads in 2022. These roads are predominantly rural single carriageways.
| Severity | Year | Motorway (Major Road) | Trunk A Roads (Non Built Up) (Major Road) | LA A Roads (Non Built Up) (Major Road) | Non Built Up (Minor Road) |
|---|---|---|---|---|---|
| Fatal | 2022 | 0.05 | 0.56 | 0.64 | 0.18 |
| Fatal | 2018-2022 average | 0.11 | 0.42 | 0.55 | 0.22 |
| All severities | 2022 | 2.79 | 4.93 | 8.9 | 3.85 |
| All severities | 2018-2022 average | 3.24 | 6.23 | 9.14 | 5.06 |
From the published 2022 data shown in Table 2-3, motorways have the lowest collision rates. The published data does not differentiate between dual carriageways and single carriageways. However, from knowledge of Scotland’s Road network, the collision rates presented for Trunk A Roads (Non Built Up) are likely to include for a substantial proportion of all rural dual carriageways collisions whilst the figures presented for LA A Roads (Non Built Up) is likely to predominately consist of rural single carriageways collisions. As the collision rates for Trunk A Roads (Non Built Up) is lower than the collision rate for LA A Roads (Non Built Up), this would suggest that Scotland’s rural dual carriageways are safer than Scotland’s rural single carriageways.
Review of Speed Related Contributory Factors
As part of the NSMP, a collision analysis was undertaken to understand current trends in Scotland. This was based upon data presented within Reported Road Casualties Scotland between 2010 and 2022. A focus was made on collisions where speed was identified as a contributory factor alongside types of vehicles.
Scottish injury collision data is currently recorded by the Police Scotland via the STATS19 proforma, which aims to ensure that data is recorded in a consistent way. As part of this reporting, contributory factors are recorded and can include “Exceeding speed limit” and “Travelling too fast for the conditions” (speed related factors). Successful implementation of speed management is likely to have a direct impact upon the prevalence of these contributory factors.
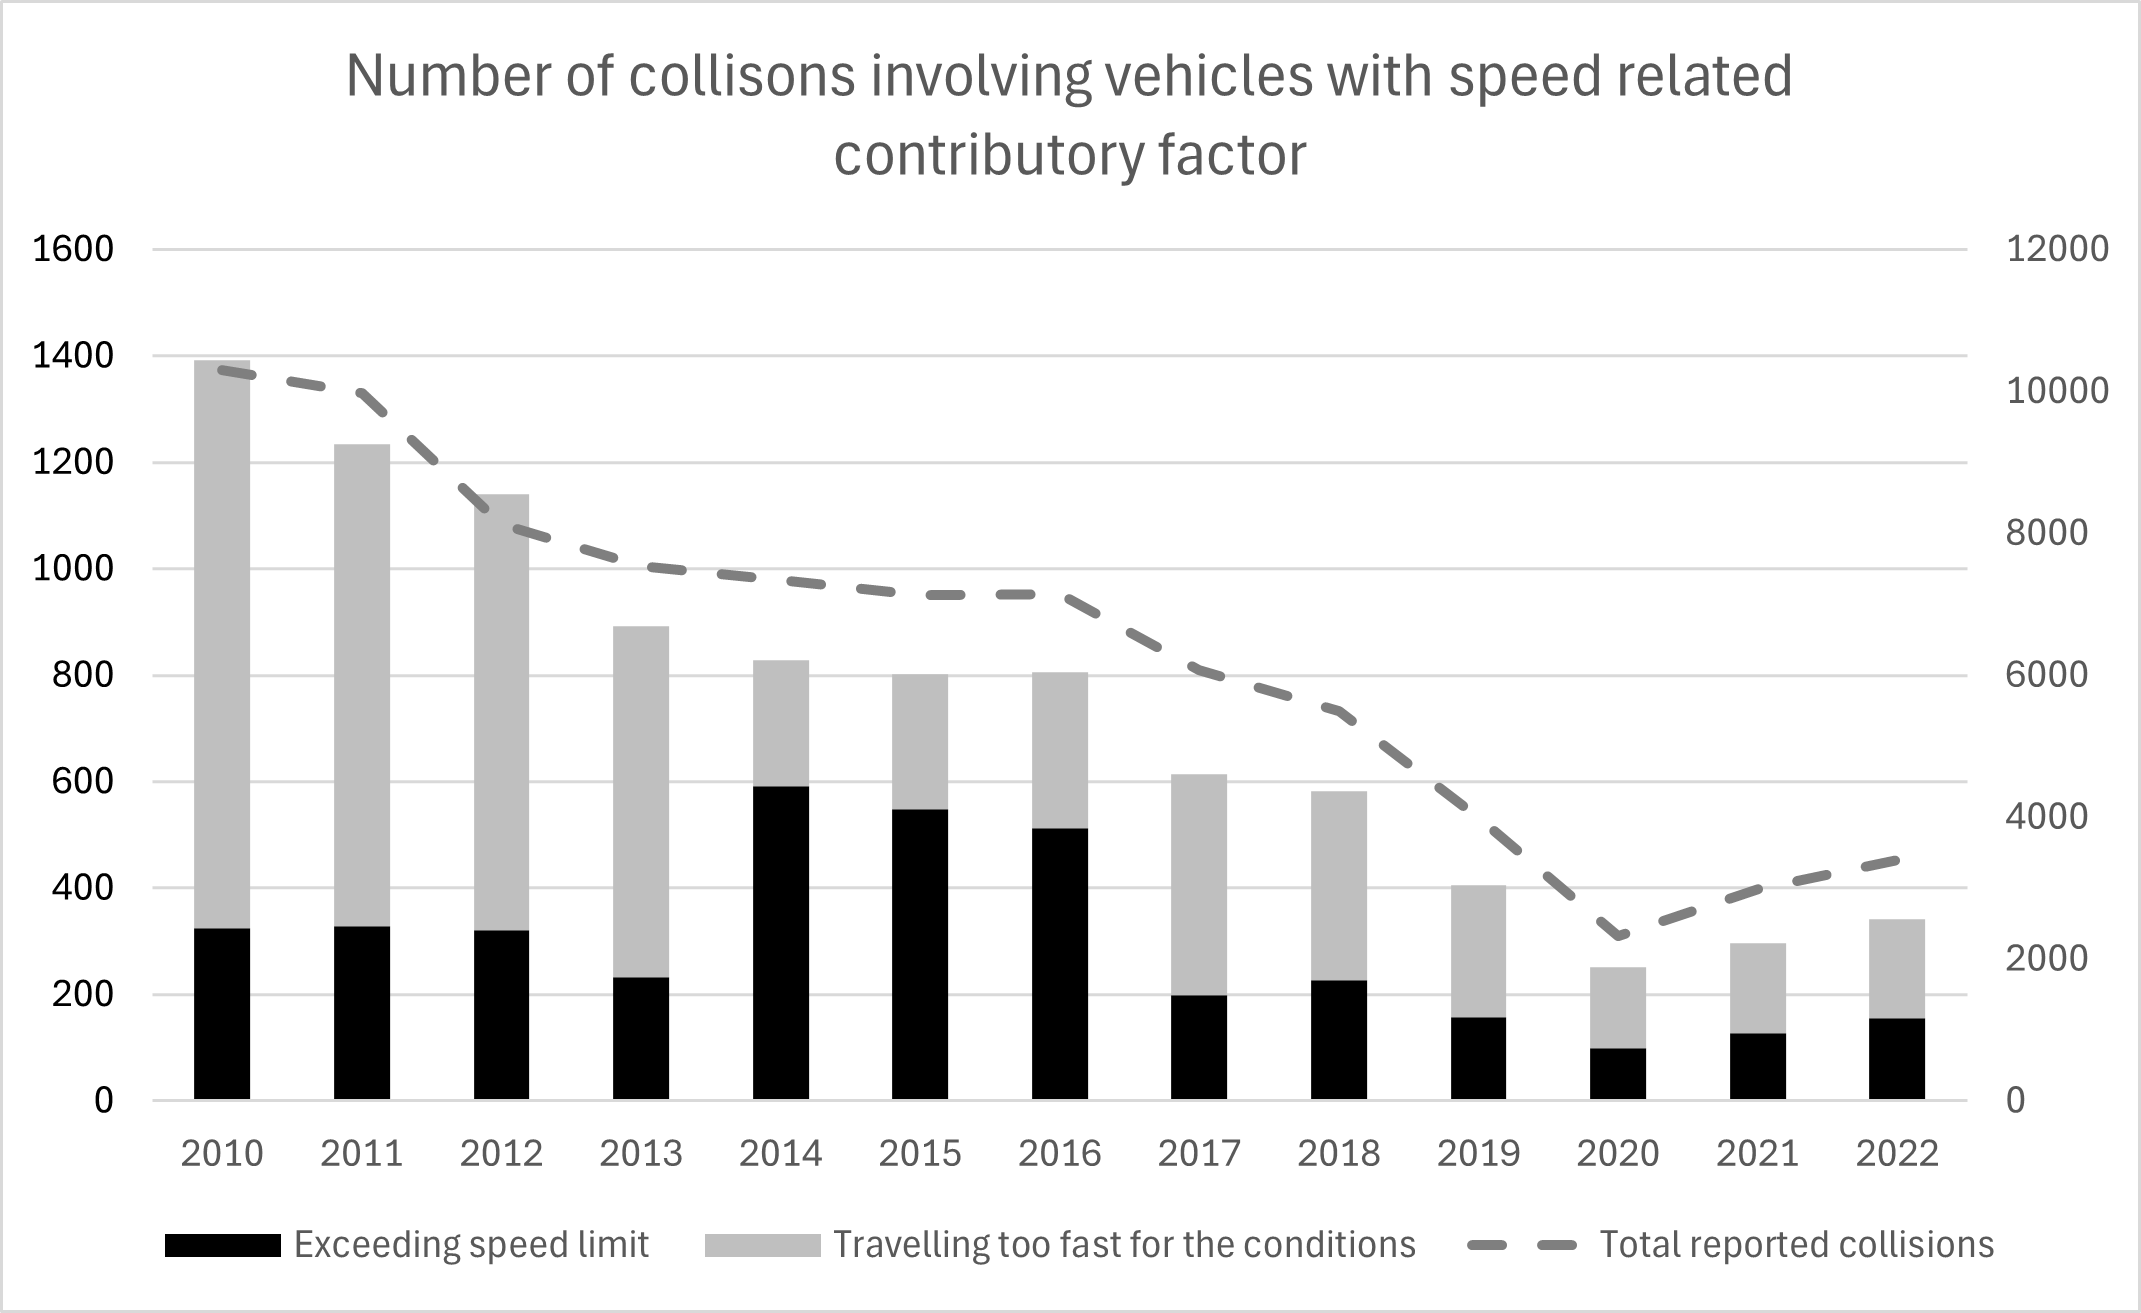
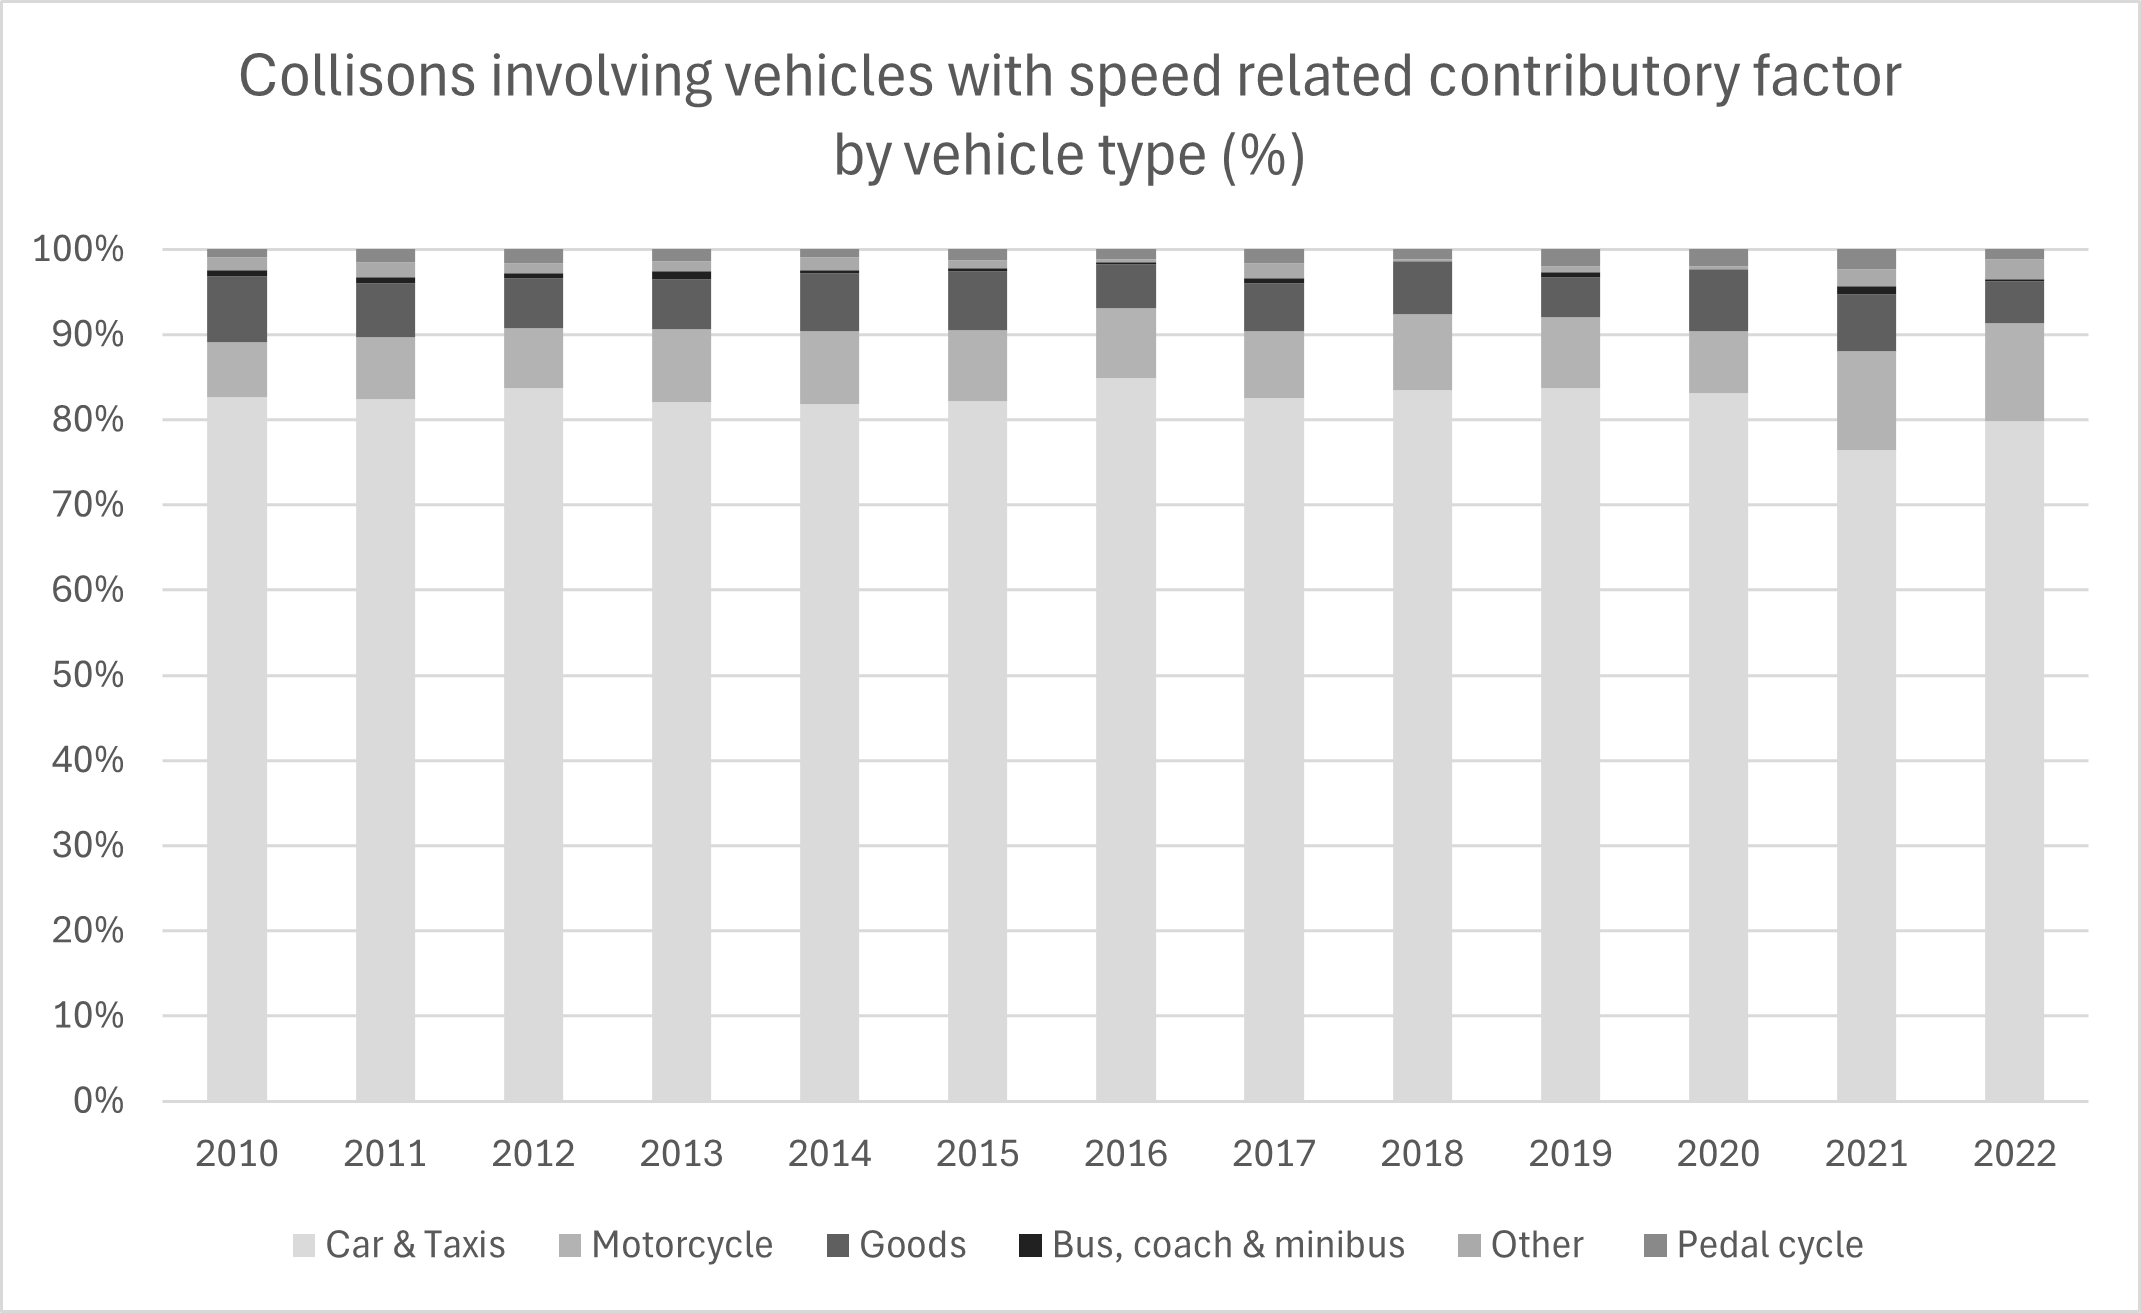
Analysis of the collision data is summarised in Appendix A and illustrated in Figure 2-1 and Figure 2-2 below. It supports the following:
- The number of overall collisions with a speed related contributory factor has broadly mirrored the trend in total collision data. In recent years circa 10-11% of all collisions have been recorded with a speed related contributory factor, falling slightly from 13-14% of earlier years.
- Of these collisions with a speed related contributory factor, around 90% involve cars/taxis or motorcycles, with circa 10% Goods vehicles.
National Speed Limits in Scotland
The National Speed Limit across Scotland varies, based upon road type, road environment and vehicle type. The current National Speed Limits in Scotland are outlined in Table 2-4 below. The National Speed Limit on roads is often not reflective of actual traffic speeds. Analysis of actual speed data suggests that road geometry and traffic conditions can often influence speeds of traffic particularly on single carriageways subject to National Speed Limits.
| Vehicle Type | Built Up Area | Single Carriageway | Dual Carriageway | Motorway |
|---|---|---|---|---|
| Cars and motorcycles | 30mph | 60mph | 70mph | 70mph |
| Cars towing caravans | 30mph | 50mph | 60mph | 60mph |
| Buses and coaches | 30mph | 50mph | 60mph | 70mph |
| Goods vehicles (<7.5t) | 30mph | 50mph | 60mph | 70mph |
| Goods Vehicles >7.5t) | 30mph | 40mph | 50mph | 60mph |
The Scotland Act 2012 provides the legal framework for the Scottish Government to set the levels of the National Speed Limit in Scotland.
The data provided in Appendix M shows that drivers in Scotland generally comply with the 60mph speed limit on single carriageway roads, with the average speed of cars noted as 51mph.
HGV Traffic in Scotland
The vast majority of Scotland’s population and economic activity is located within the central belt. There are however rural communities, for example, within the Highlands and Islands which are further away from Scotland’s land border with England. HGV traffic forms a substantial proportion of economic activity.
Within these remote areas there are significant industries including fisheries for which increased journey times would have a negative impact upon the value of perishable goods being transported. A significant proportion of this traffic heads towards the English border via the A74(M) at Gretna prior to onwards transit in England and onto Europe. This traffic often originates from ports across Northern Scotland and the Highlands such as Scrabster, Aberdeen, Ullapool, Uig, Mallaig and Oban.
Speed differentials between different traffic types
The difference in speed between two vehicles is referred to as speed differential. The closer the speed of two vehicles, the easier it is for drivers to make well informed decisions and reduce the likelihood of road traffic collisions.
The varying speed limits of different vehicle types is most significant where HGV speed limits are lower than that of faster vehicles such as cars. It is recognised that lower HGV speeds can lead to driver frustration and risky manoeuvres by other road users. In such circumstances STATS19 recording of collision may not record an HGV as being involved in a collision.
Transport Scotland carried out an evaluation in 2018, the evaluation has identified that there is poor compliance with National Speed Limits by HGVs within Scotland. The main findings of the evaluation include:
- On single carriageway trunk roads in Scotland (4% of the Scottish rural road network) the HGV 2016 baseline average free flow speed of HGVs was 48.2mph, well in excess of the existing 40mph speed limit;
- The speed differential between HGVs (44.6mph) and light vehicles (48.9mph) on single carriageway non-trunk roads (40% of the Scottish rural road network) in 2016 was lower than on trunk roads, reflecting the slower average speeds on such roads, despite the limit of 60mph for non-HGVs; and
- The free flow average speeds suggest that the characteristics and topography of these non-trunk single carriageway roads are likely to be contributing to constraining average speeds for both light and heavy vehicles.
Road Safety Context – Summary of Findings
The review of baseline road safety conditions and road safety context in Scotland has identified that whilst progress has been made towards achieving the desired Scottish Government Road Safety Framework 2030 targets, further interventions will be required to support their achievement.
Speed was reported as a contributory factor in circa 10% of all reported injury collisions and 26% of fatal collisions in Scotland in 2022. The majority of collisions (around 80%) involved cars/light vehicles with a further 11% involving motorcycles. Furthermore, Local authority A roads (Non Built Up) had the highest collision rates on Scotland’s roads in 2022. These are typically single carriageways in rural environments.
HGV Speed Limit compliance with posted speed limits is poor in Scotland. Nonetheless, there is a speed differential between HGVs and other vehicles though this differential is lower on non-trunk than on trunk single carriageways. It is recognised that the lower HGV speed could cause driver frustration resulting in increased risk taking.