Appendix M - Scotland Scale of Change Analysis
Background
Agilysis have been commissioned by Transport Scotland to deliver six separate online dashboards and interactive maps which comprise a Speed Compliance Tool. This analytical platform has been developed for clients in Great Britain over the last five years and offers network-wide analysis of vehicle speeds using a number of data source from different suppliers, matched to the Ordnance Survey Highways road network.
The Agilysis Speed Compliance Tool is typically used to understand driver behaviours and inform effective speed management strategies with data available for individual road sections. It uses connected vehicle data to provide 12-month average speeds across 14 different time periods as well as an All Day (24/7) average speed value.
In conjunction with the delivery of the Speed Compliance Tool and the processing of this data for Scotland and Transport Scotland’s on-going considerations of safer speed limits across its network, Agilysis was asked to carry out analysis of speed limit compliance by drivers, and from that assess the scale of change in the event of changes to the legal speed limit on higher speed roads (excluding motorways). The aim of the analysis is to review existing speeds, and casualties, then estimate what scale of change could be expected if speeds are reduced.
Methodology
For the purposes of this analysis, connected vehicle probe data has been used to determine vehicle speeds across the road network. There are several commercial suppliers of this data and we have chosen data supplied via Basemap. The data includes the following:
- Indicative Speed Limits. This data is obtained from Ordnance Survey (OS) and supplied by Basemap under licence from a third party, Insight Warehouse.
- All Day Average Speed. This data is supplied directly to Agilysis from Basemap under licence from a third party, Teltrac Navman.
- Modelled Average Annual Daily Traffic (AADT). Raw probe count data for road sections are supplied to Agilysis from Basemap under licence from Teltrac Navman. These probe counts are used to create a national traffic model using DfT Count Point data.
About the GPS Data
Location data from hundreds of thousands of connected vehicles with GPS devices installed (e.g. vehicle trackers & sat nav devices) is matched to the road network, and the journey times calculated over each road link are used to determine the average speed travelled by each connected vehicle. This speed data is then aggregated over the space of a year to provide average and 85th percentile speeds.
Under the assumption that speed distributions on roads broadly follow a normal distribution around the mean, speed profiles can be estimated for every road link in Scotland. These distributions have then been used to estimate the proportion of drivers travelling at speeds in excess of any set threshold. When aggregated up, these can be used to indicate the volume of traffic exceeding the current speed limits, or any proposed set of limits across Scotland.
AADT volumes are modelled across the network using a combination of probe counts from connected vehicles and ground truth from the Department for Transport’s count point data. (‘Ground truth’ data is information collected via traditional, physical sensors or images which are then compared to remote-sensed data such as GPS in this case.) A statistical (Bayesian) model is used to estimate the proportion of traffic included in the connected vehicle fleet, and therefore determine the extent to which connected vehicle probe counts need to be inflated in order to reflect known daily vehicle counts at locations where both data sources are available. The result is an estimate of traffic volume across every road in Scotland.
The probe data used in this instance was collected from vehicle trips between January 2023 and December 2023. This data was supplied by Ordnance Survey processed by third parties and matched to the OS Highways road network.
Scale of Change Methodology
A filter was applied to the road network to ensure it is suitable for analysis:
- Roads marked at 60mph or 50mph in the OS Indicative Speeds database.
- Roads with a value >0 for all-day average speed
- Roads with an estimated AADT of above 250
- Roads marked as 'single carriageway' or 'dual carriageway' in the OS database. This excludes roads marked as 'roundabout' for example or roads with restricted access such as farm tracks
Using reproducible analysis previously used in projects elsewhere in Great Britain, we have interrogated the data to understand the percentage road length and number of vehicle kilometres travelled on roads where the all day average speed is greater than each 1mph interval between 60mph and 40mph. This detailed analysis allows an in-depth understanding of speed profiles, rather than simply analysing a single proposed speed limit e.g. 50mph. The data is categorised by road class to show the difference in average speed compliance on A roads, B roads and Unclassified roads.
Official DfT collision data from the most recent five year period (2018-2022) has been matched to the same individual road sections for which the speed and traffic volumes were provided. This complex dataset can then be used to estimate changes in casualties that may arise, should speeds be reduced. The estimations have been based on the most recent evidence of global studies (Elvik et al 2019).
Results
60mph Roads
Average speeds by road length
The existing data indicates there is already good compliance of 60mph speed limits in Scotland with 0% of the A road, B road or Unclassified road network reporting all day average speeds in excess of the speed limit. (Average speeds above the speed limit is reported on a small length of roads in each road class group but as a percentage of total road length and allowing for rounding the percentage is nil.) DfT statistics for a small sample of roads does indicate that around 9% of car drivers exceed the national speed limit (NSL) but it would be rare for any section of road to see this figure exceed 50%, hence the reporting of 0%. The average speed of cars on NSL roads is 51mph. Our estimates are that only around 4km of 60mph roads have an average speed above 60mph. It is worth re-stating here that this is not reporting that drivers aren’t exceeding the speed limit, just that average speeds rarely exceed the limit when all traffic is taken into consideration.
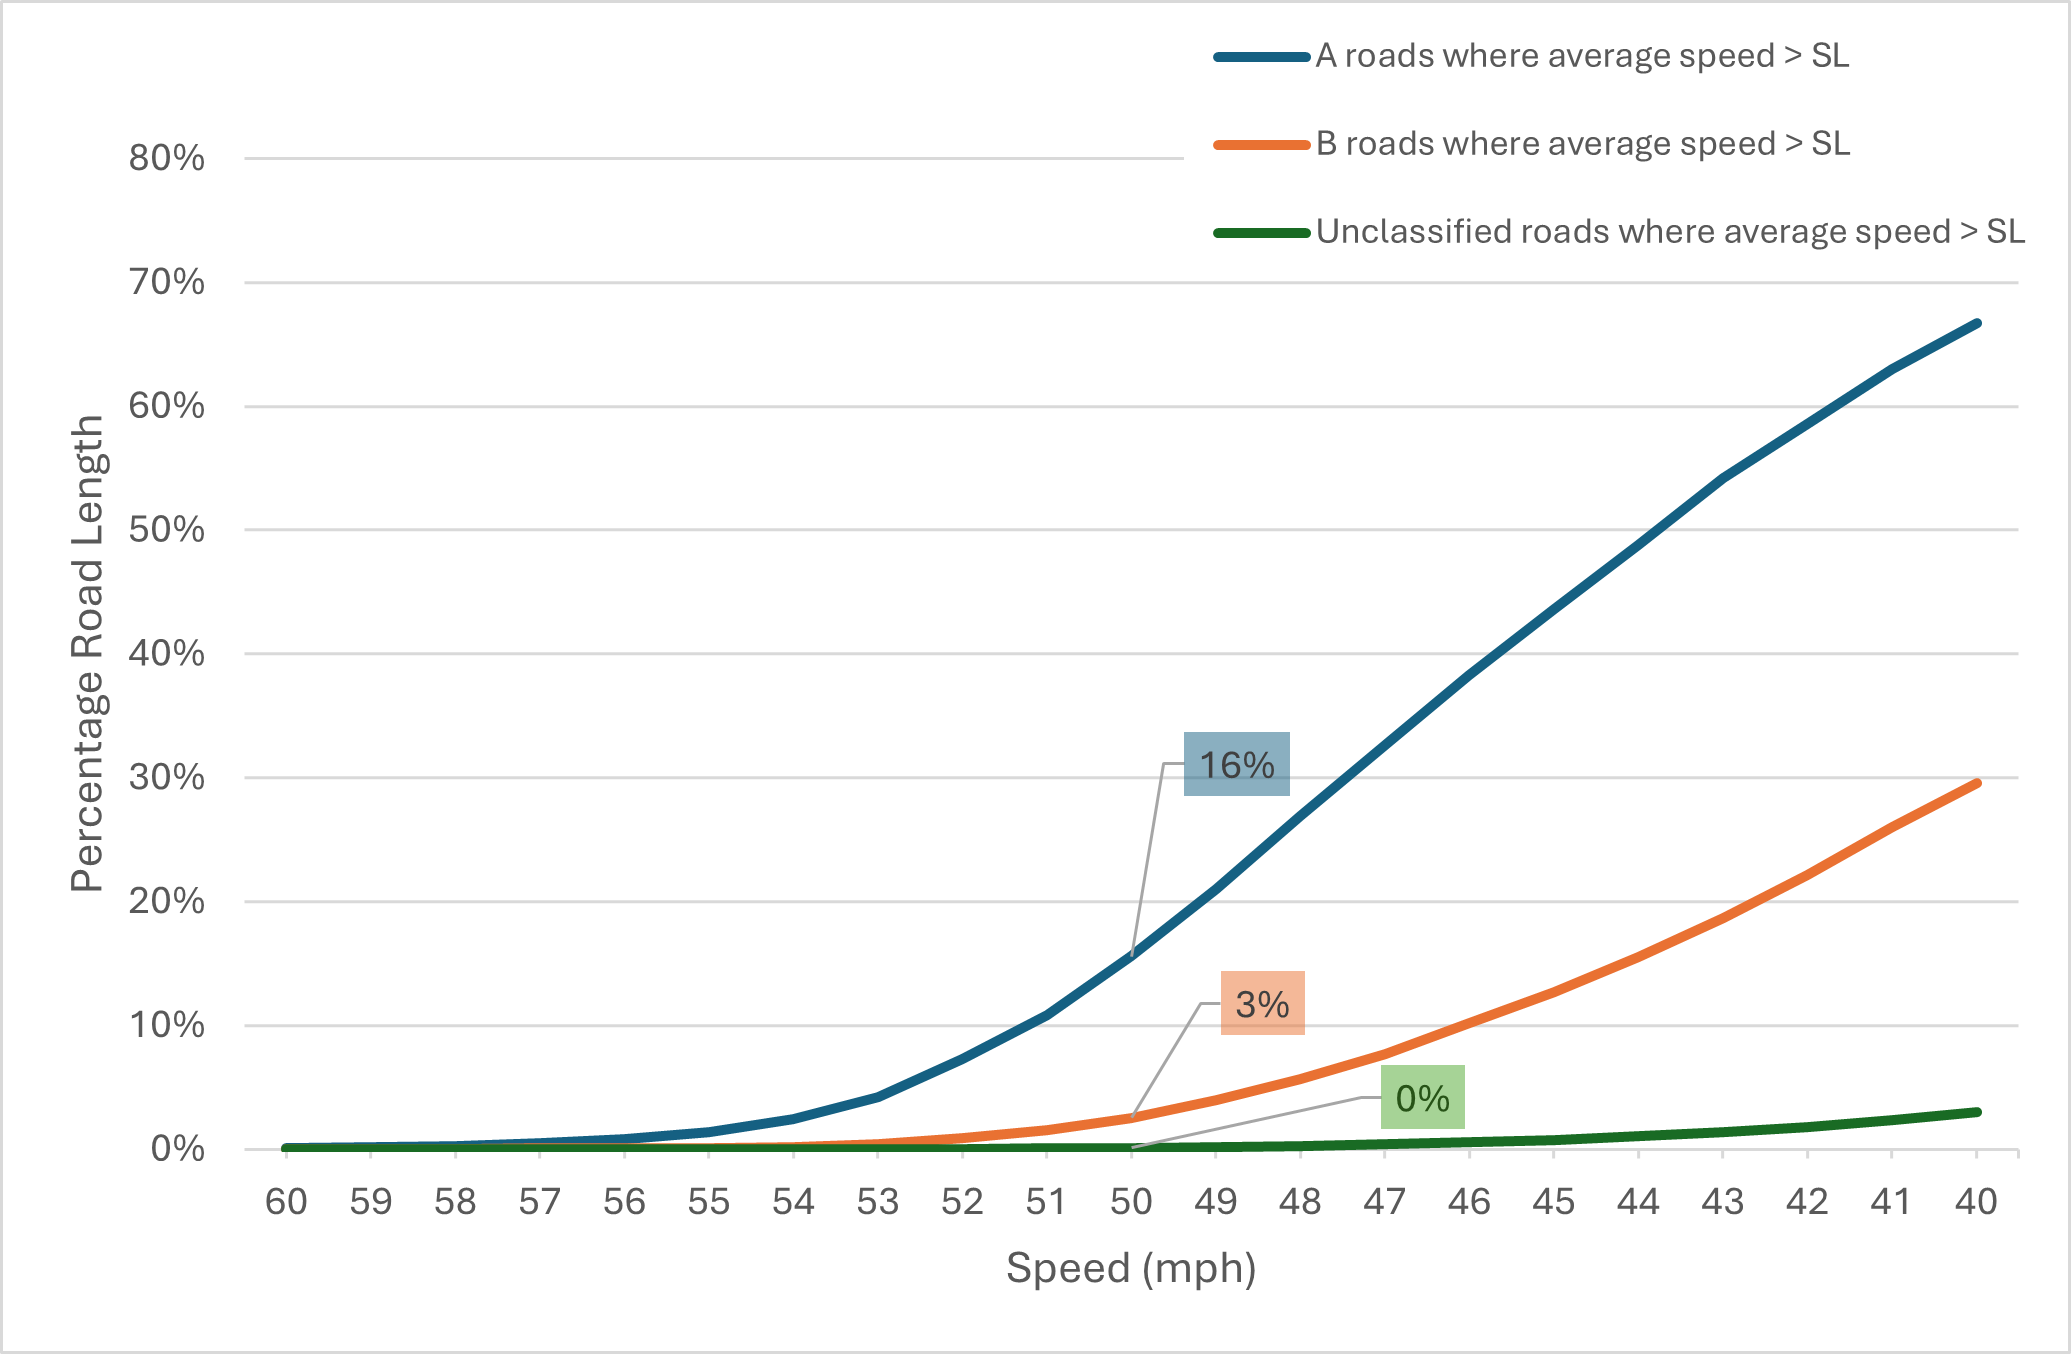
The percentage of network on which all day average speeds exceed a given threshold unsurprisingly increases network wide as that threshold falls from 60mph. The percentage of road network on which average speeds are in excess of a given speed threshold increases most significantly on A roads from 16% at 50mph to 67% at 40mph (Figure 1). This means that, should a lower NSL of 50mph be implemented and no change in driver behaviour be seen, then just over one in six roads by length would see average speeds above that limit.
Only a 3% of the B road network reports all day average speeds exceeding 50mph, and for unclassified roads it is almost undetectable (0% when rounded to the nearest whole percent). This is likely reflective of the typical characteristics of these routes; often narrower, more sinuous routes where traffic volumes are lower and the movement, and therefore speed, of traffic is less significant to the place.
Average speeds by Traffic Flow
In addition to analysing the speed data for Scotland in terms of road length we can also provide insight on the relative traffic flow on each class of road on which all day average speed is more than a given speed threshold. The Speed Compliance Tool contains data on modelled AADF which is then used alongside the traffic speed statistics to calculate an estimated percentage of traffic exceeding the limit. It should be noted here that this is not an observed figure and is subject to significant variation for individual roads, although across the network error is expected to be lower. While this data is useful for the purpose of this project, Agilysis would recommend the use of other, observed statistics in any in-depth analysis and post-implementation research.
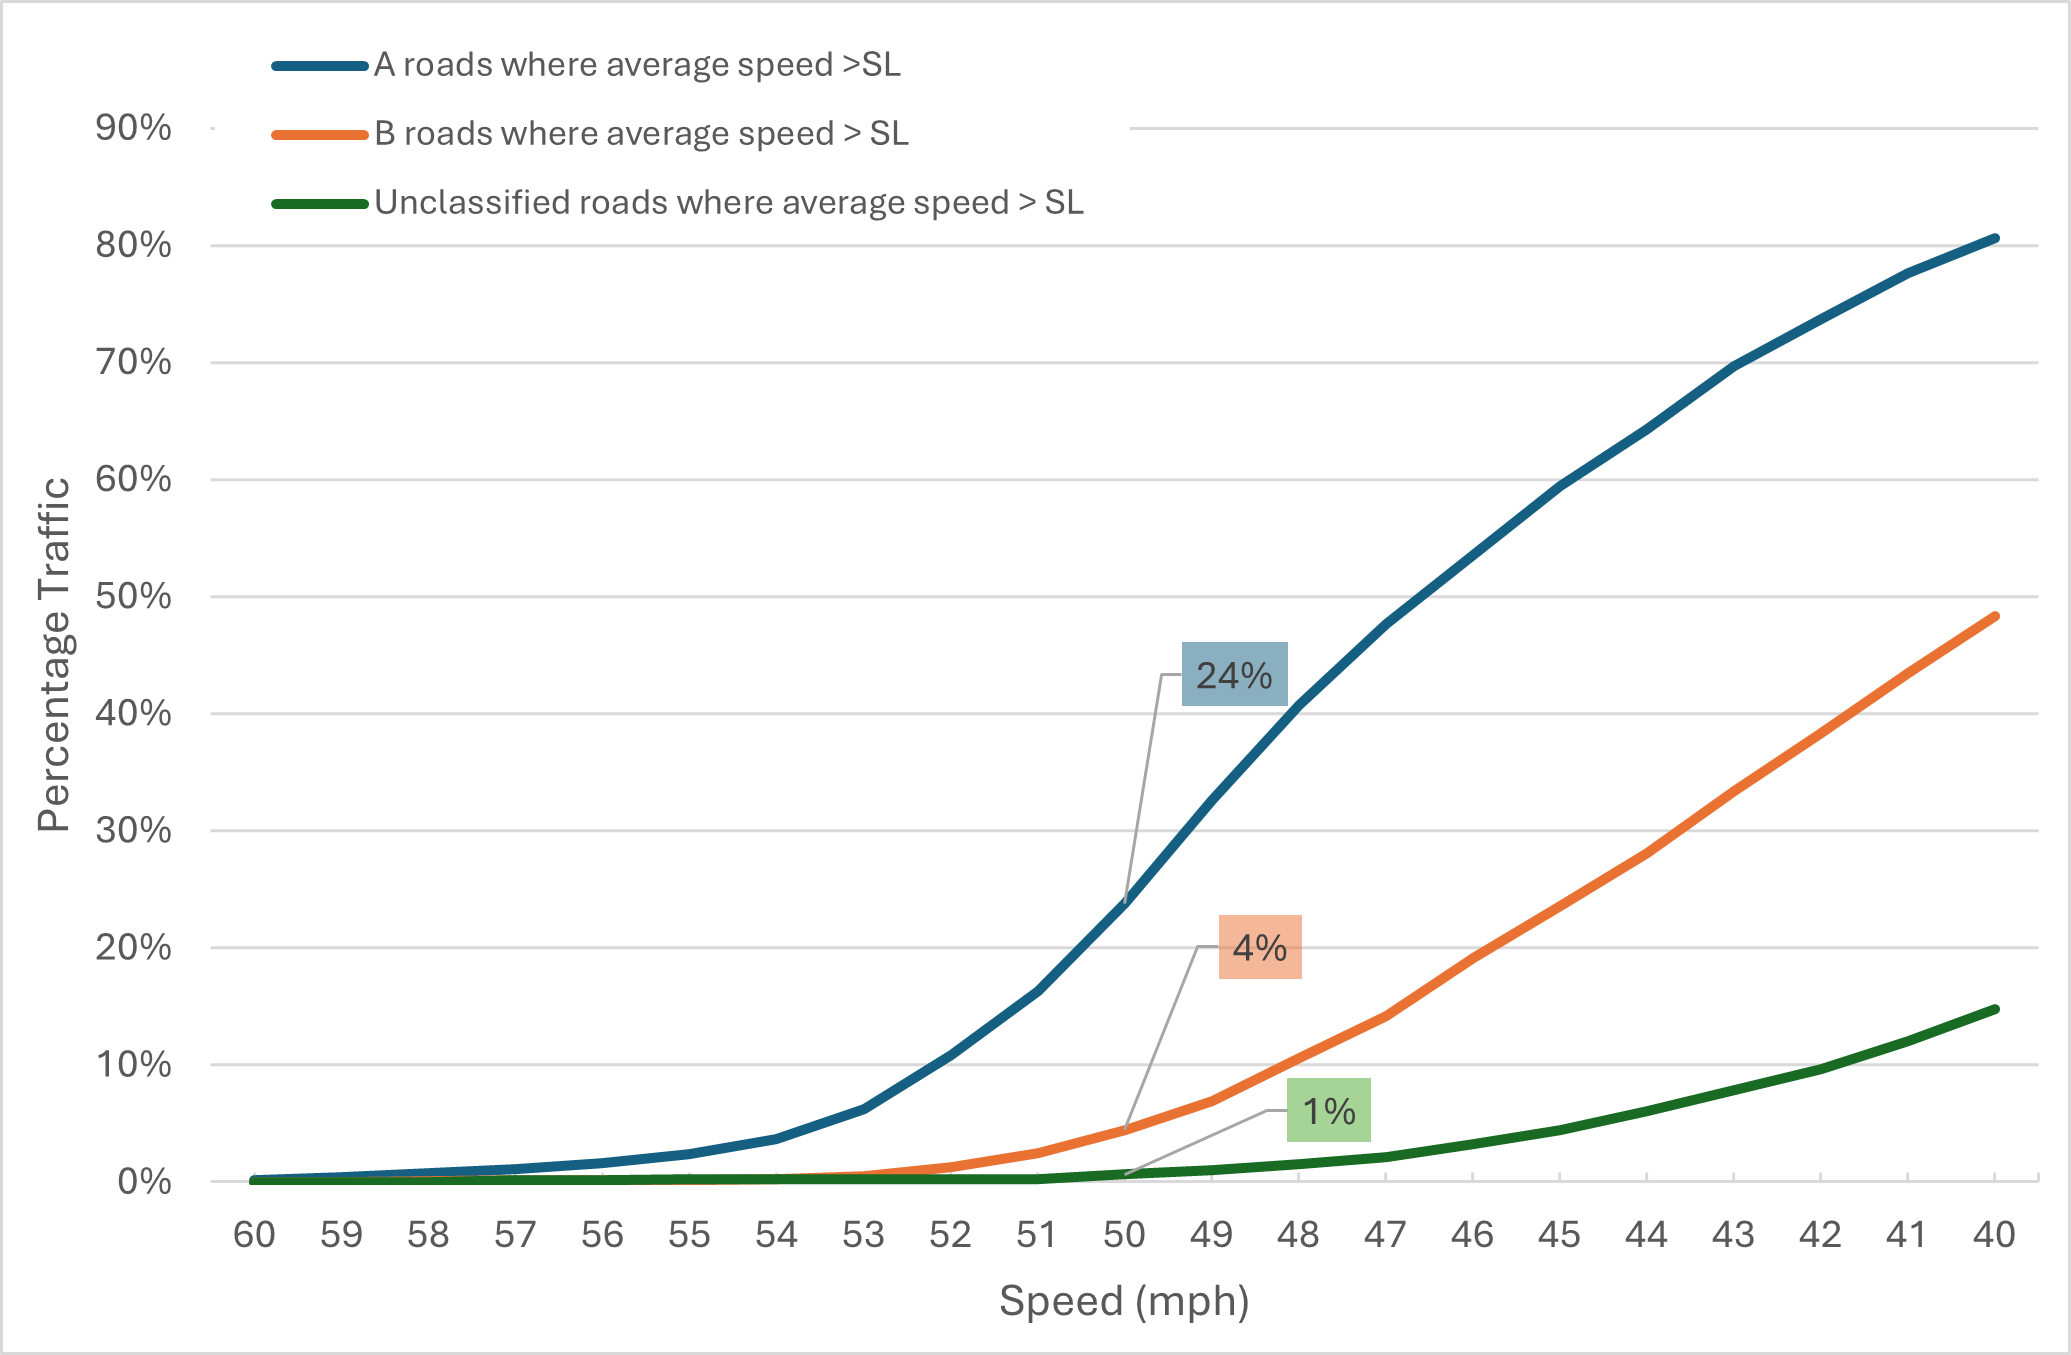
The advantage of using this measure, rather than percentage road length, is that it takes account of higher traffic volumes on faster roads. The trend line for the three road classes is very similar with higher classification roads seeing higher traffic speeds. This data in Figure 2 shows that almost one in 4 (24%) of drivers travelling on A roads at speeds above 50mph. For B roads this is much lower at only 4%, with unclassified roads only seeing around 1% of traffic at or above that speed.
Including data on speeds below 50mph is especially useful in this analysis. Even at 40mph, on unclassified roads merely 15% of traffic is travelling at or above this speed. For B roads it is almost half (48%) and a significant majority of vehicles are exceeding 40mph on A roads (81%).
50mph Roads
Average speeds by road length
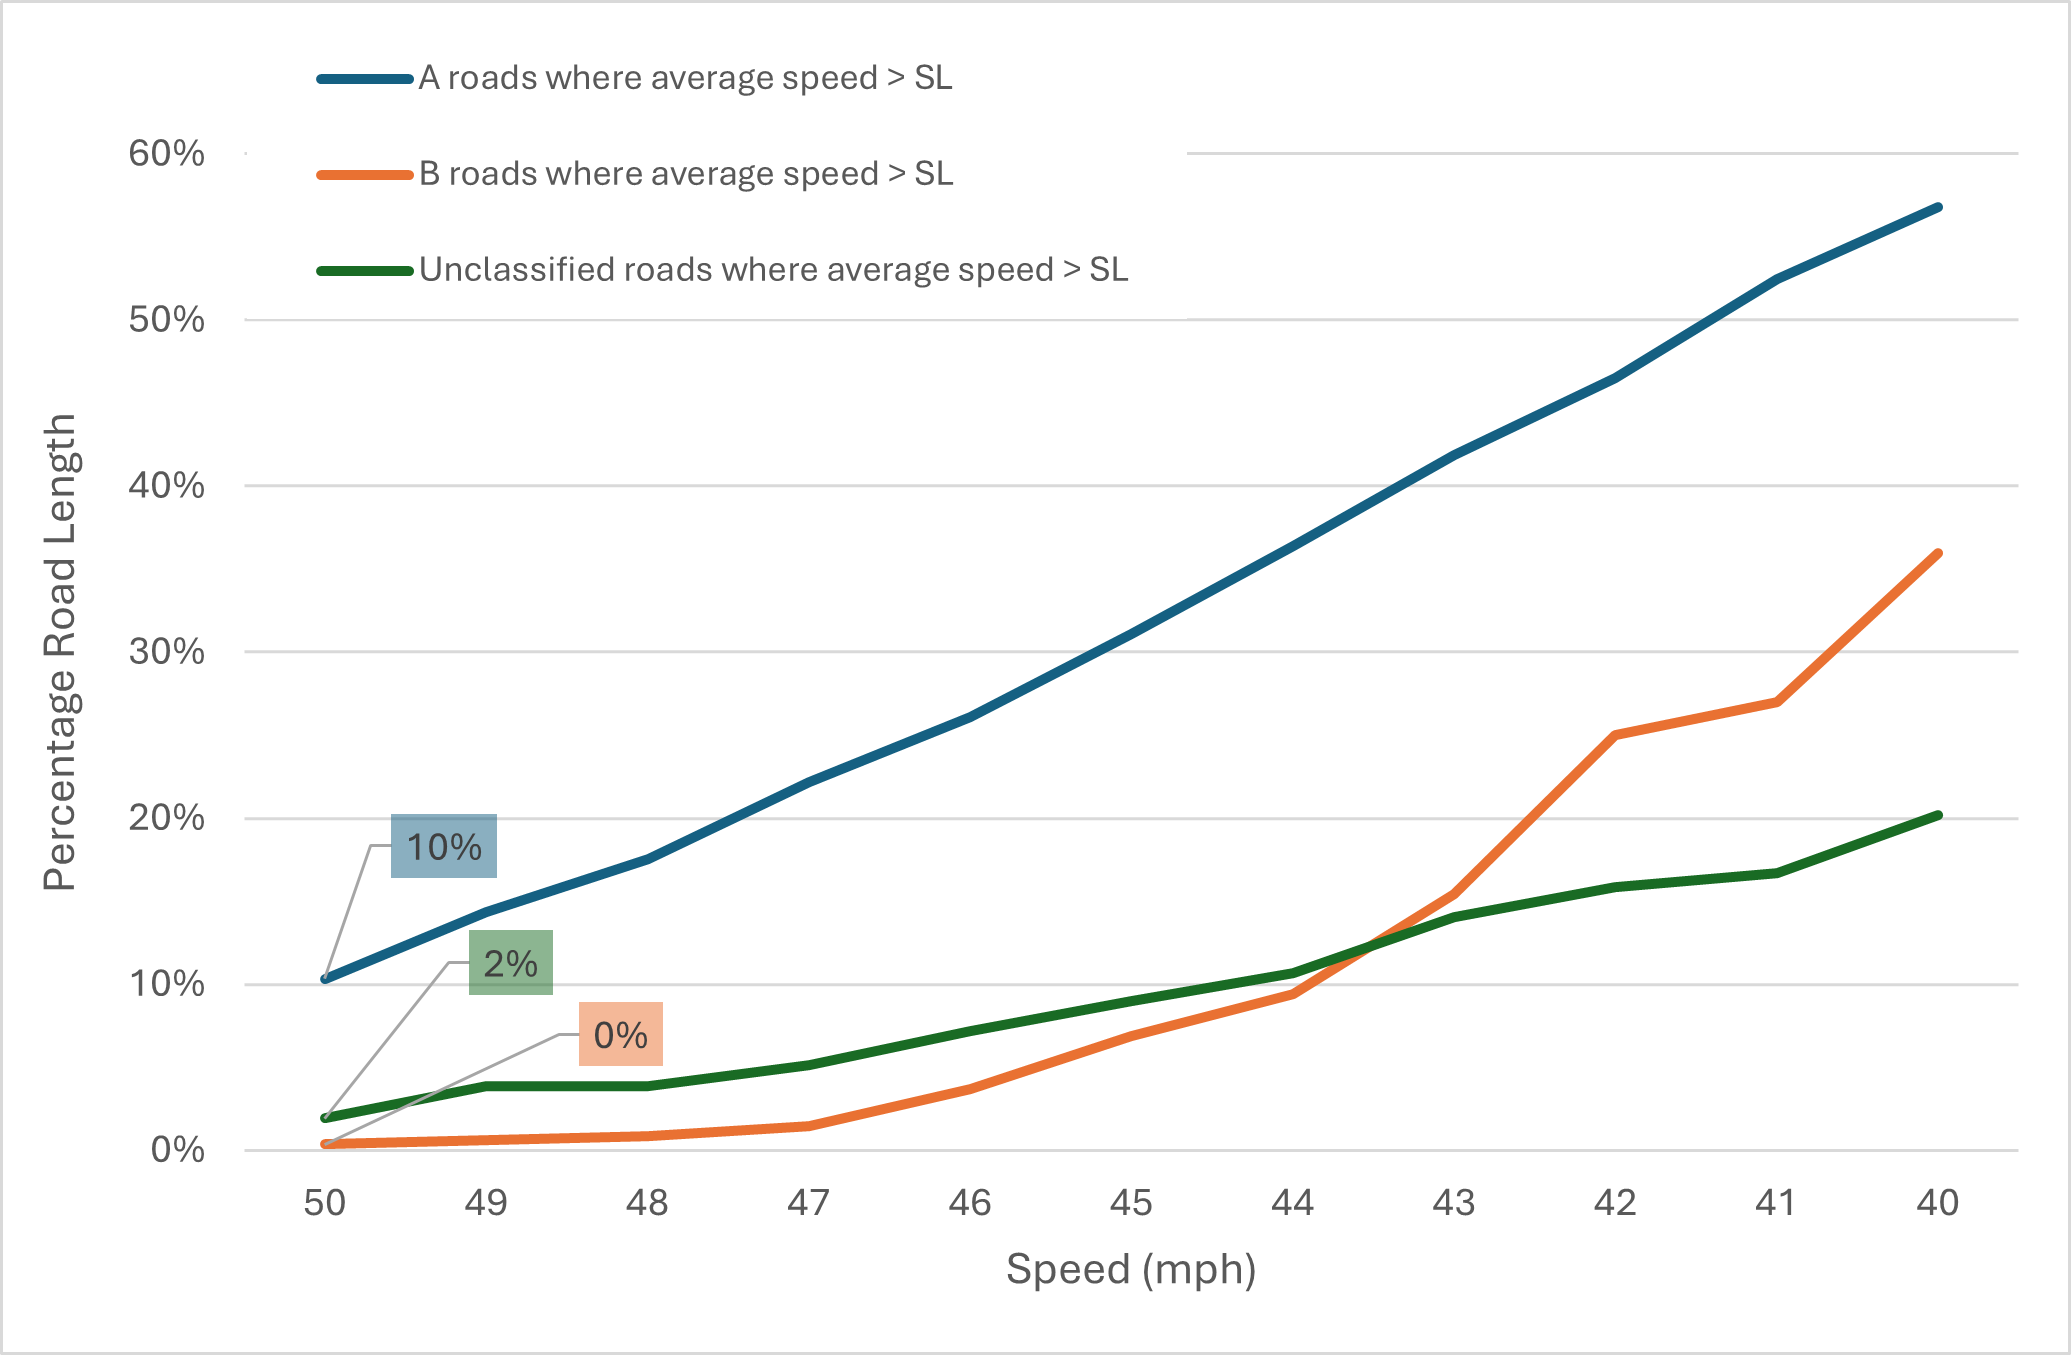
Analysis of 50mph roads was included in this report as an example of what compliance looks like on roads already subject to a lower limit. The results of the analysis for 50mph roads shows that on A roads around 10% of the network has average speeds in excess of the limit with negligible values for B roads (2%) and none for unclassified roads (Figure 3).
Average speed by traffic volume
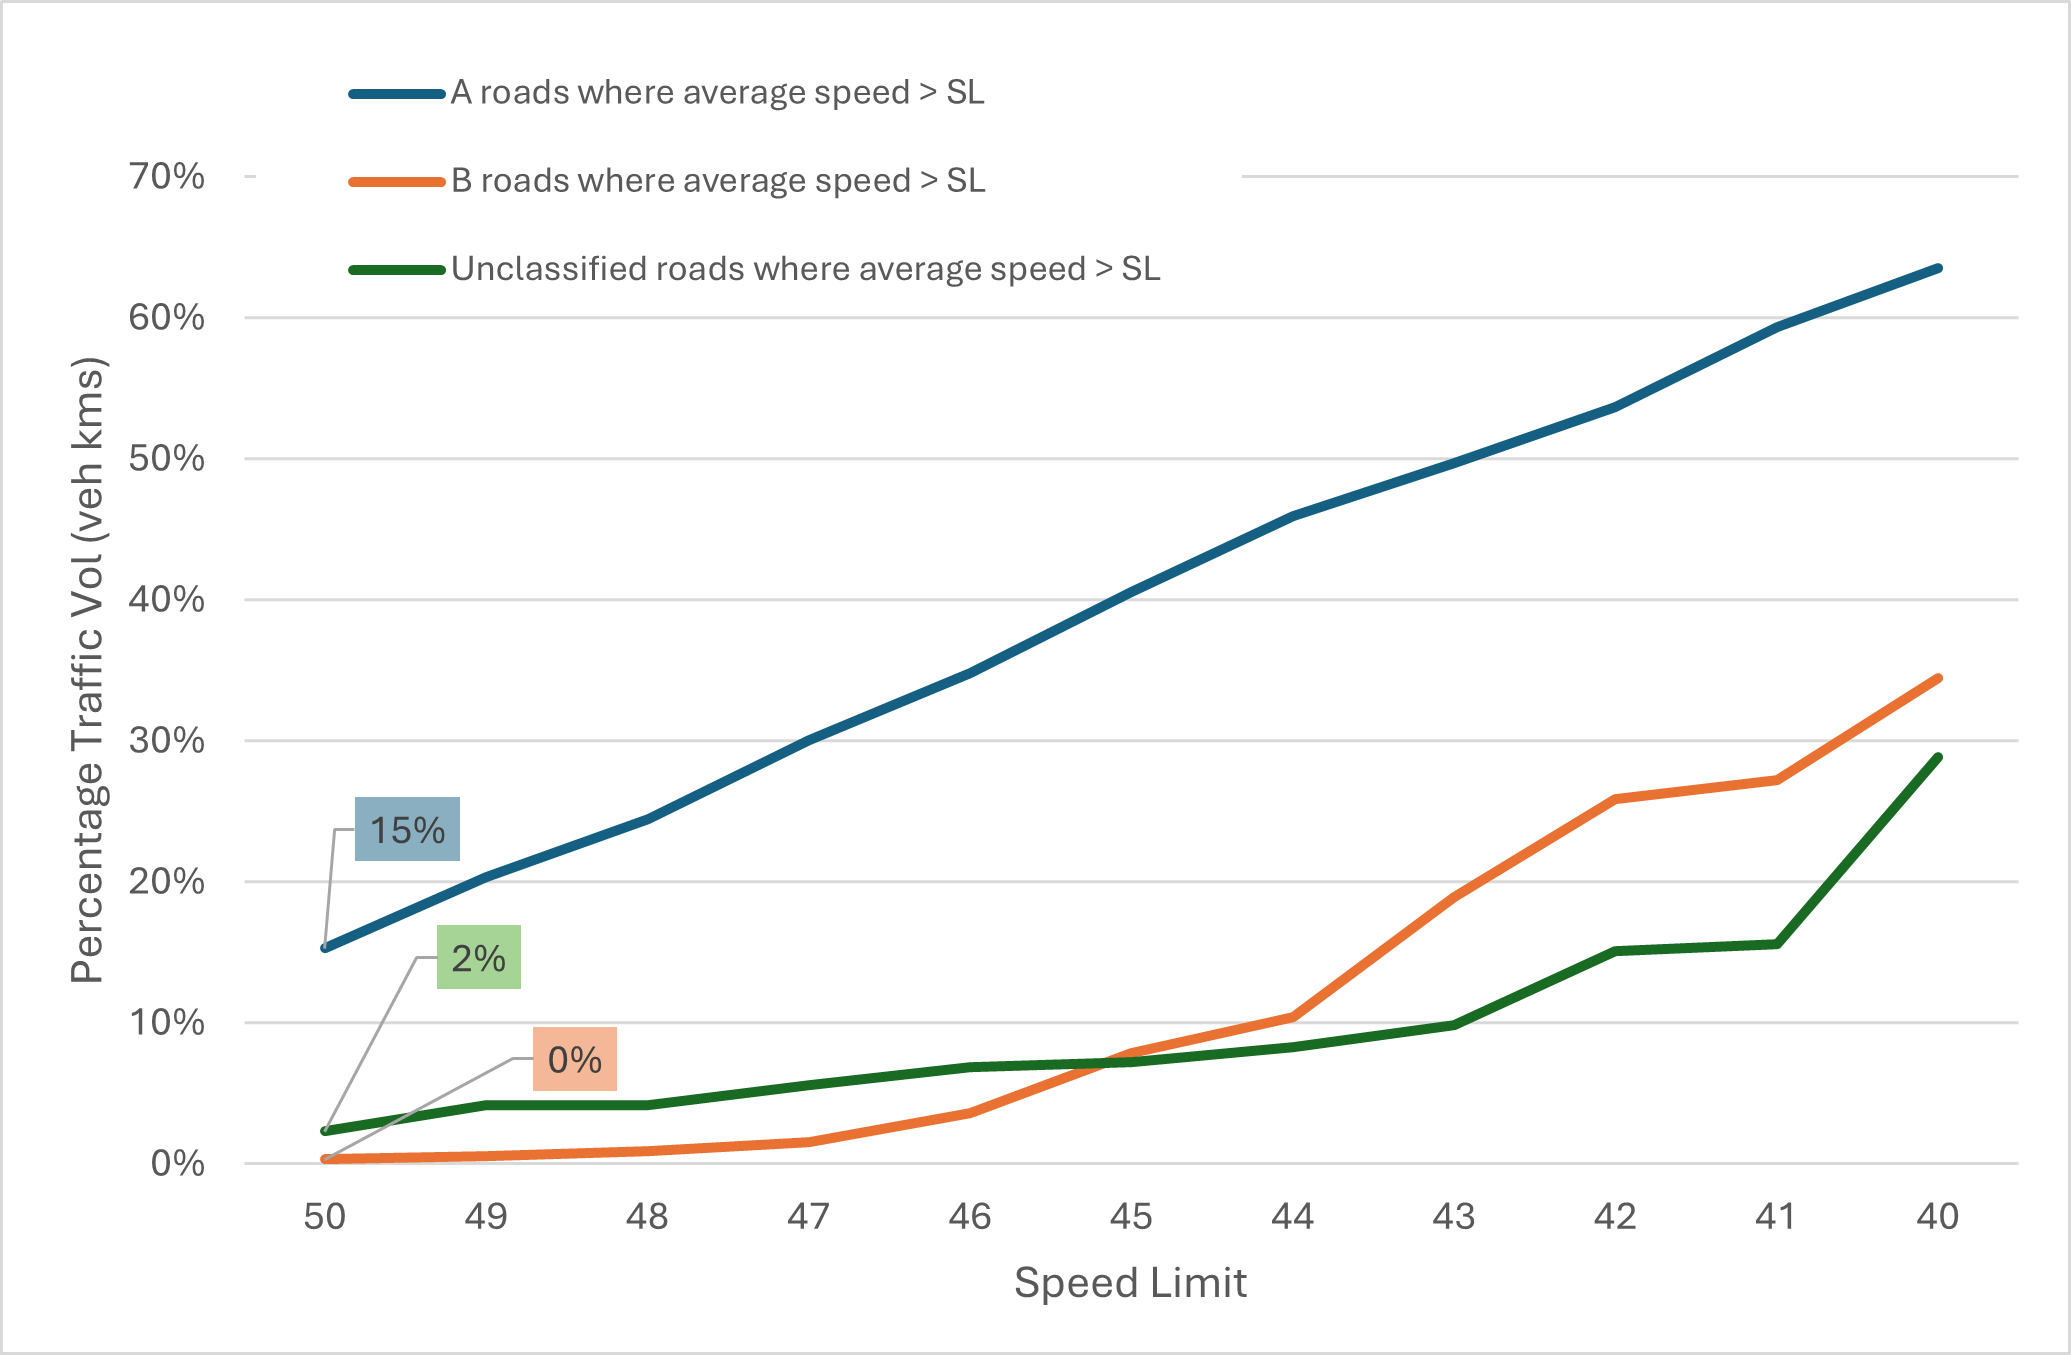
The analysis on the percentage of traffic travelling on 50mph roads where average speeds are more than the speed limit, and 1mph intervals to 40mph shows very similar results to the percentage road length (Figure 4).
Overall the percentages are higher on A roads with 15% of traffic travelling at speeds that are higher than the 50mph limit. Figures for B roads and unclassified roads are very low although it is worth noting that the value for unclassified roads is higher than that for B roads. It is worth noting that road lengths, and therefore sample sizes are low with only 80km of B roads in the sample and 50km of unclassified roads.
Casualty Analysis
Using official DfT STATS19 collision data for the 5 year period 2018 – 2022, we have matched collisions to the 60mph and 50mph road network across Scotland. This automated matching process uses road class and road number, together with proximity to the nearest road section for classified roads, with a simple proximity matching applied for unclassified roads. This data is not included within the Speed Compliance Tool but it is separately created for all roads in Great Britain each year by Agilysis.
Understanding and then estimating any change in casualty numbers as a result of changes in speeds and speed limits is subject to significant debate. The influence on road deaths of small changes in vehicle speeds is well understood and has been subject to many studies. The current favoured model is one measured in Elvik et al (2019) referenced earlier in this report. This exponential model estimates that for each 1kmh drop in speeds, an 8 percent reduction in road fatalities will occur. The same model estimates that all casualties will drop by 6%. No figure is provided for serious casualties, partly due to the differing way in which casualty severity is recorded across the world. This model has been adopted by the World Bank in its materials supplied to countries through the ‘Speed Management Hub’ including an Excel-based ‘Speed Impact Tool’.
We have applied the exponential model from the research and estimated the potential impact of every 1mph reduction in speed on fatalities and all casualties. The approach assumes that, for individual roads where traffic speeds are above the limit, average speeds will reduce to the set value on the chart. Where traffic speeds on individual roads are below that value, we assume no potential for casualty reduction. It is worth noting that we cannot be sure what impact any change in speed limits would be and there are clear weaknesses in this approach.
The first limitation is the assumption about future traffic speeds being reduced to precisely the set speed limit. Evidence from changes in rural speed limits in France showed that, where existing speeds were slightly below the previous 90kmh speed limit (86.4kmh), the change in legislation to 80kmh saw a drop to 83.1kmh after just over one year. This drop in speeds has been associated with a significant reduction in casualties with reductions of between 8% and 10% in fatalities on roads subject to the new speed limit. As existing travelled speeds in Scotland are already largely below 50mph, there is uncertainty whether speeds could drop further, rise to meet the new limit, or stay largely the same.
The second limitation is that we do not know what impact the change in limit would have on speed distribution. Presently there is a relatively wide distribution of traffic speeds on NSL roads with some drivers travelling at much higher speeds than others. This is most noticeable in the case of goods vehicles which are subject to a lower limit than cars and motorbikes for example. The impact of a lower limit would equalise limits for many vehicle classes and potentially create a narrower distribution of speeds. Furthermore, a lower speed limit may discourage overtaking manoeuvres by drivers wishing to process at the higher speed limit, but who are restricted by slower vehicles in front. No evidence is offered on these scenarios however which should be subject to literature review.
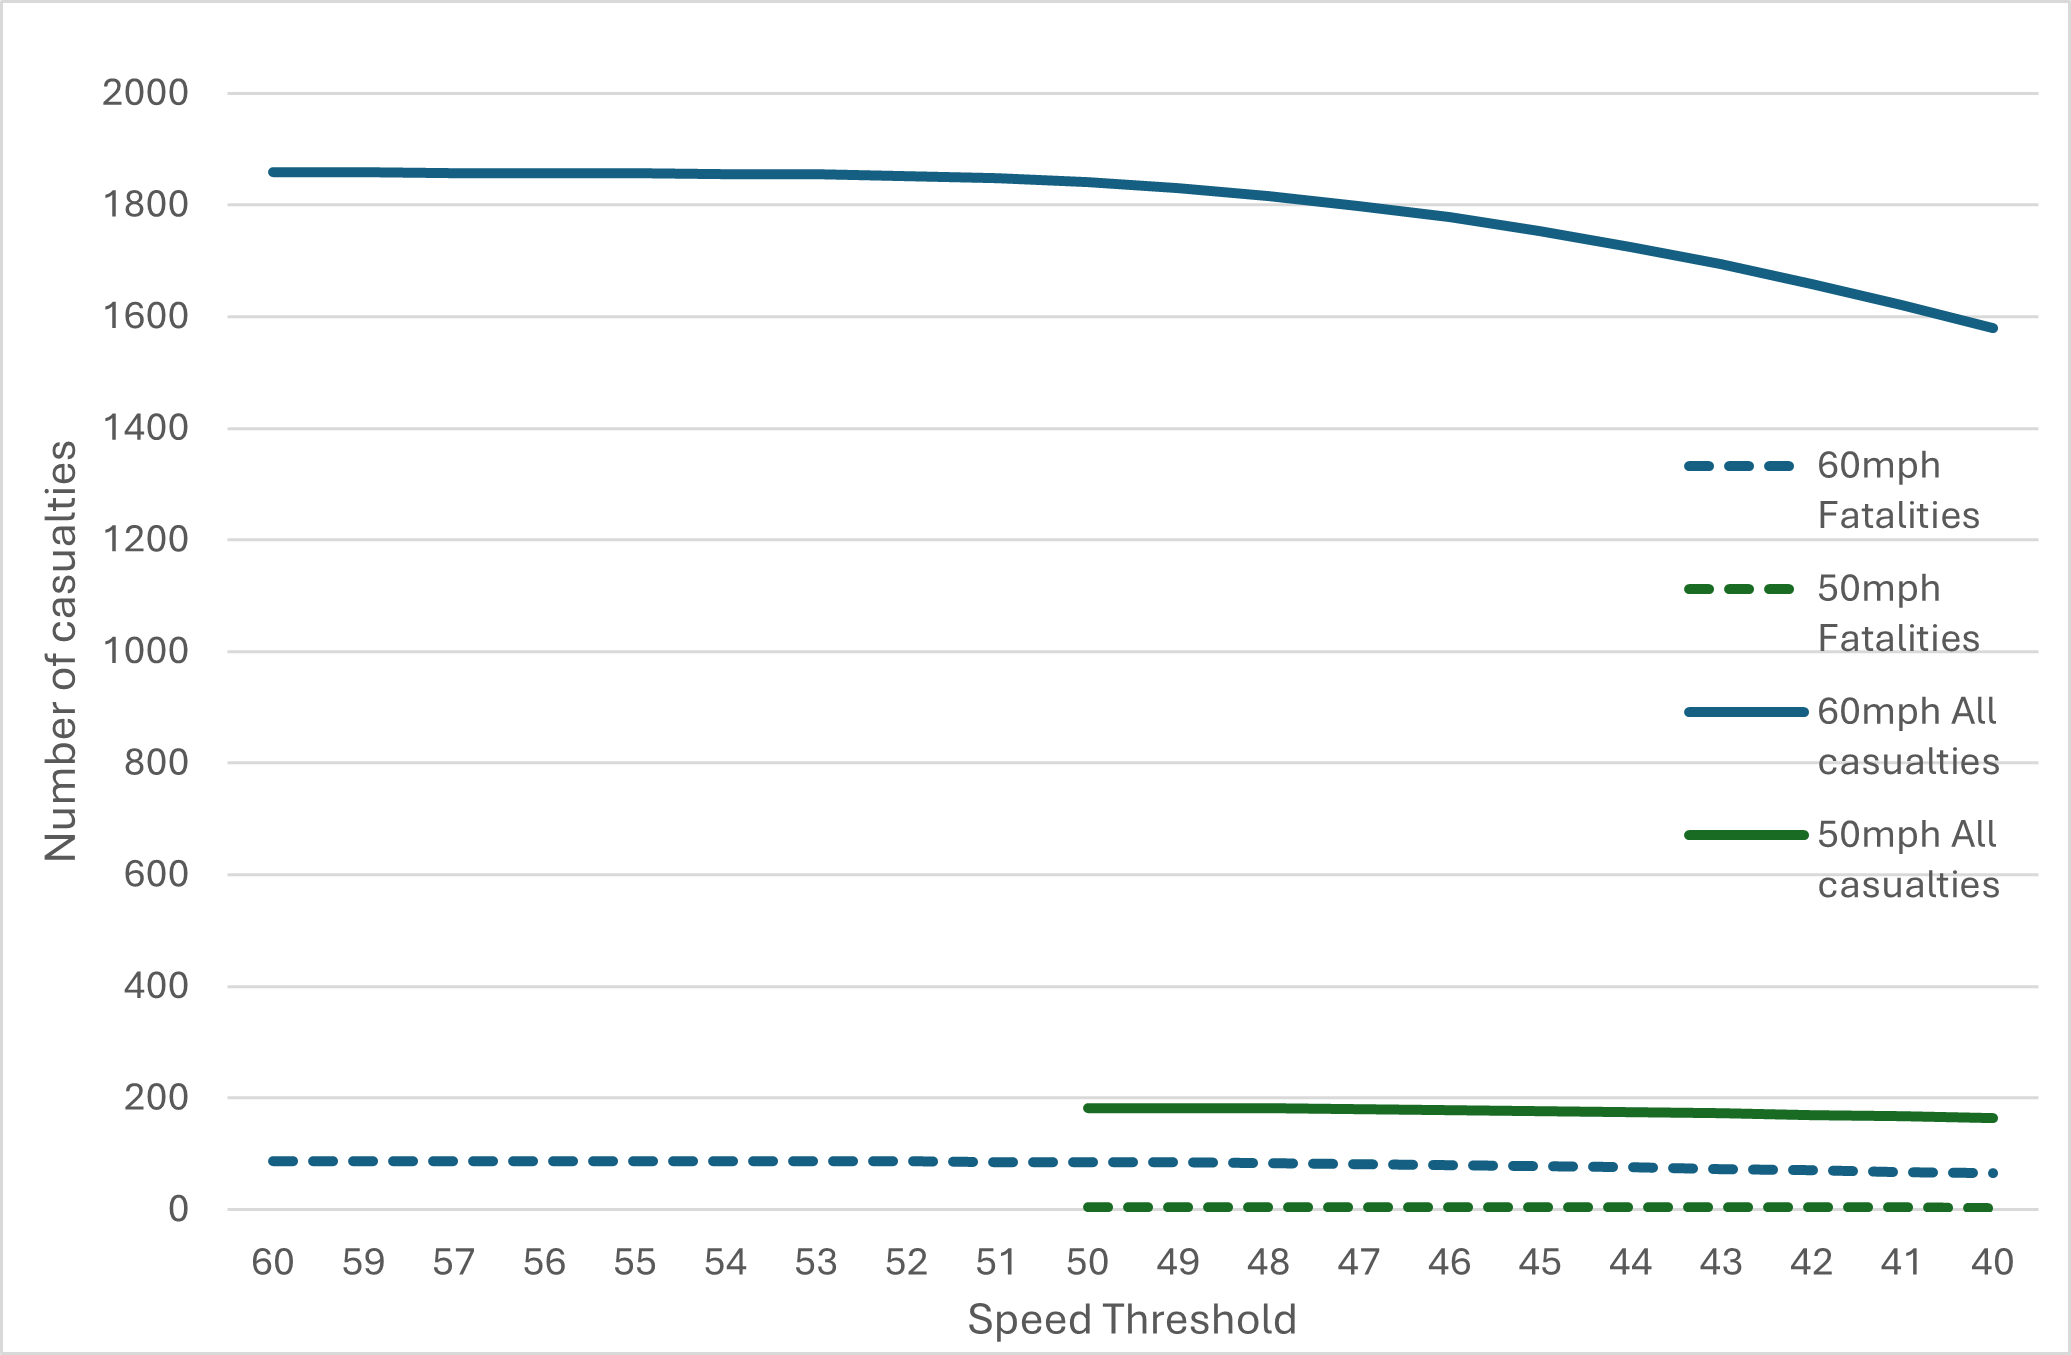
Given the aforementioned limitations, the data reveals that fatal casualty reduction as a result of reducing the national speed limit on from 60mph to 50mph would be 1.7% and all casualty rates would fall by 0.95% (Figure 5). This result is unsurprising given the analysis of speeds already present on the network. For fatalities around one and half road deaths would be reduced at 50mph, although this increases significantly at lower speed. At 45mph the reduction would be 8.9 road deaths and at 40mph for example the reduction would be 22 road deaths. The data for all casualties (which would include those road deaths) indicates a reduction of 17.7 casualties at 50mph, again dropping rapidly at 45mph by 105 casualties, and at 40mph by 278 casualties.
Conclusions
The evidence on the link between traffic speeds and casualties is well understood, as is evident on current operating speeds on rural, single-carriageway roads. Estimating the impact of changes in speed limits using network-wide vehicle data produces a good indication of what the impact would be on travelled speeds as well as casualty reduction. Impacts would be more significant on A roads, with negligible impacts on lower classification and unclassified roads due to existing lower speeds. Precisely what would happen to driver behaviours and speed choice is uncertain, although evidence from other countries shows that an immediate reduction in speed would be likely. It is entirely possible that the predicted reduction in casualties is significantly underestimated in this analysis, as demonstrated by casualty reductions in France. A reduction in fatalities of 12% only requires a change in average speeds of 1mph, something that could easily be seen on roads in Scotland.