Appendix I – Economic Assessment Report
Introduction
The economic assessment of the indicative value for money of the speed management proposals encompasses the valuation of conventional transport economic impacts, the findings from a literature review and estimated cost impacts. Analysis of some distributional impacts of the proposals has also been undertaken to provide further insights into the anticipated socio-economic impacts.
The estimation of the impacts of the proposals is based on a comparison between the ‘without scheme’ (Do Minimum) and ‘with scheme’ (Do Something) scenarios over the life of the appraisal period. For the purposes of this economic assessment an appraisal period of 30 years has been assumed reflecting the futures relate to policy rather than the asset life of new infrastructure.
In line with appraisal guidance (STAG), the values of impacts are rebased and discounted from the year they occur to 2010 to produce Present Value results (presented in market values).
Impacts Assessment
Quantified impacts
The quantified impacts of the proposals have been estimated using the outputs generated from Transport Scotland’s Transport Model for Scotland (TMfS) version TMfS18. Model runs were undertaken for the following options (to be compared against the ‘without scheme’ reference case):
- Option 1: Reduced National Speed Limit on single-carriageway roads from 60mph to 50mph, all vehicles excluding HGVs; HGVs speed limit increased to 50mph.
- Option 2: Reduced National Speed Limit on single-carriageway roads as for Option 1, plus reduced national limits on dual carriageways including motorways from 70mph to 60mph, all vehicles excluding HGVs; HGVs speed limit increased to 50mph for single carriageway and 60mph for dual carriageway.
For each of these, two futures were modelled:
- 100% compliance
- Realistic compliance
And for each option an assessment against the TMfS18 ‘with policy’ and ‘without policy’ forecast scenarios was run (identified as 1A, 1B, 2A and 2B respectively as shown in Table I-1), where the ‘with policy’ forecast scenario assumes:
- 20% reduction in car-kilometres by 2030;
- Ban on the sale of new petrol and diesel cars and vans by 2030; and
- Net zero emissions by 2045.
Table I-1 – Identified Future Descriptions
|
Future |
Identified Future |
|
“Without Policy” |
1A |
|
“With Policy” |
1B |
|
“Without Policy” |
2A |
|
“With Policy” |
2B |
These policy scenarios equate to the low and high motorised transport behaviour scenarios respectively in Transport Scotland’s STPR2 scenario planning.
Runs for three modelled years (2025, 2030 and 2045) were undertaken.
The quantified impacts assessed are:
- Transport User Impacts
- Safety Impacts
The assessment approach for each category of impact is described below.
Transport User Impacts
DfT’s TUBA (Transport Users Benefit Appraisal) version 1.9.17 and the corresponding relevant economic parameters from the TAG Data Book v1.22, November 2023, have been used to process the transport model outputs and calculate the following impacts:
- Travel time changes
- Vehicle Operating Cost (VOC) changes
- Fuel VOC
- Non-fuel VOC
- Indirect tax revenues
Safety Impacts
DfT’s accident appraisal software, ‘Cost and Benefits to Accidents – Light Touch’ (COBALT) is the default method to assess scheme safety impacts. However, COBALT is not very sensitive to minor flow differences given it uses speed bands of 10mph as the basis for analysis. This means that if the modelled changes in average speeds are relatively slight, they may not fall within a different speed band within COBALT, resulting in no discernible impact.
Therefore, due to the scale of the network under consideration for this economic assessment an alternative approach has been applied to estimate the potential monetised impact of accident savings as a result of the proposals. This approach has been developed based on a review of similar studies, with the two most relevant described below.
Table I-2 – Summary of Similar Studies
|
Country |
Study Name |
Study Type |
Urban/ Rural |
Study Focus |
Appraisal Approach |
|
United Kingdom |
Reduced road speeds from 30 to 20 mph in Wales |
Urban |
Economy, Safety and Environment |
Appraisal approach: monetised Safety impacts: impacts appraised based on the change in speed in new and old scenarios on the selected network to calculate the counter factual incidents with the help of The Power Law. The reduced incidents were monetised with the average value of prevention per casualty by their severity cost from TAG. |
|
|
Ireland |
Rural road speed limit higher than 60 kph; in urban area higher speed limit of 50 kph applied to key radial routes and 30 kph to all other routes |
Urban and Rural |
Economy, Safety and Environment |
Appraisal approach: non-monetised Safety impacts: impacts appraised based on the change in speed limits within the assessment model to calculate the vehicle kilometres travelled on the specific road type with the permissible speed limit. In rural areas, single carriageway roads shift traffic to faster routes, which provides more safety. The overall changes in lowering the speed limit increase the net increase in distance travelled across the rural road network. The impacts of the speed limit changes were calculated in terms of the change in vehicle kilometres. |
Of both studies, the Wales one was viewed as more transferable for assessing the safety impacts based on changes in speed and therefore provides the approach used in this economic assessment.
To estimate the benefits of improved road safety, average casualty details from the two years (2021-22) (Year 2023 collision data was not available at the time of assessment) from the Stats 19 database have been taken for the in-scope network for their respective road type in the categories of rural roads/freeways (motorways) and urban/residential roads. The following assumptions have been applied:
- For future years safety impact forecasting, current year monetised values have been grown based on Value of Time Growth per annum (November 2023, TAG Databook, Annual Parameters) and then discounted to 2010 PV using standard discounting factors.
- The impact of reduced speeds has been estimated using a power law based on estimates from Elvik (2013) for rural and urban road categories, as given in Table I-3. This estimates the reduction in incidents using the following formula:
counter factual incidents = baseline incidents * ( (new speed) / (old speed) )α
Where 𝛼 has been selected as the exponent (best estimate) from Table I-3, based on the road categories and type of incident/accident to calculate the counter factual incidents based on new and old speeds. The difference between baseline and counter factual incidents is the estimated change in incidents/savings in accidents for a particular incident type resulting from the change in speed limit.
Table I-3 – Summary Estimates of Exponents by Traffic Environment
|
Accident or injury severity |
Rural roads/ freeways (Best estimate) |
Rural roads/ freeways (95% of confidence interval) |
Urban/ residential roads (Best estimate) |
Urban/ residential roads (95% of confidence interval) |
All roads (Best estimate) |
All roads (95% of confidence interval) |
|
Fatal accidents |
4.1 |
(2.9, 5.3) |
2.6 |
(0.3, 4.9) |
3.5 |
(2.4, 4.6) |
|
Fatalities |
4.6 |
(4.0, 5.2) |
3.0 |
(-0.5, 6.5) |
4.3 |
(3.7, 4.9) |
|
Serious injury accidents |
2.6 |
(-2.7, 7.9) |
1.5 |
(0.9, 2.1) |
2.0 |
(1.4, 2.6) |
|
Seriously injured road users |
3.5 |
(0.5, 5.5) |
2.0 |
(0.8, 3.2) |
3.0 |
(2.0, 4.0) |
|
Slight injury accidents |
1.1 |
(0.0, 2.2) |
1.0 |
(0.6, 1.4) |
1.0 |
(0.7, 1.3) |
|
Slightly injured road users |
1.4 |
(0.5, 2.3) |
1.1 |
(0.9, 1.3) |
1.3 |
(1.1, 1.5) |
|
Injury accidents – all |
1.6 |
(0.9, 2.3) |
1.2 |
(0.7, 1.7) |
1.5 |
(1.2, 1.8) |
|
Injury road users – all |
2.2 |
(1.8, 2.6) |
1.4 |
(0.4, 2.4) # |
2.0 |
(1.6, 2.4) |
|
Property-damage-only accidents |
1.5 |
(0.1, 2.9) |
0.8 |
(0.1, 1.5) |
1.0 |
(0.5, 1.5) |
# Confidence interval specified informally.
The change in incidents has been monetised using the values shown in Table I-4. The value of improved road safety takes into account direct costs associated with incidents such as medical and police costs. It also considers people’s willingness to pay to avoid injury and death and the value of lost economic output from casualty sufferers.
Table I-4 – Average Value of Prevention per Casualty by Severity and Element of Cost £ (2010 Prices and 2010 Values)
|
Casualty Type |
Net output |
Willingness to pay |
Medical & ambulance |
Total |
|
Fatal |
107,978 |
1,537,896 |
927 |
1,646,800 |
|
Serious |
20,800 |
150,550 |
12,600 |
183,950 |
|
Slight |
2,199 |
11,020 |
933 |
14,152 |
|
Average, all casualties |
6,562 |
52,141 |
2,910 |
61,613 |
Source: TAG Table A 4.1.1, November 2023 v1.22.
Further Considerations
Assessment in the round
Along with the conventionally quantified impacts of the proposals, for which there are established valuation methods, there are further considerations of impacts that can be assessed using evolving methods or qualitatively, as well as the distribution of the impacts, both geographically and by different groups of society. Those considered in this economic assessment are described below.
Environmental Damage
As part of a literature review of the impacts of reducing the speed limit on roads, evidence has been sought of the consideration of environmental impacts (as well as other effects). This desk-top research identified studies and their findings for speed limit changes across the globe indicating environmental (and safety) benefits from reducing speed limits.
Distributional Impacts
A Social and Distributional Impact assessment has been undertaken following the Department for Transport (DfT)’s Transport Analysis Guidance (TAG) Unit A4.1: Social Impact Appraisal and the distributional impacts have been assessed based on TAG Unit A4.2: Distributional Impact Appraisal.
The social groups focus on vulnerable groups identified within the Equalities Act, and relate to age, ethnicity, those with disabilities, gender, and economic categories. TAG sets out the type of analysis and recommends datasets to use during the analysis of these welfare impacts upon those groups.
Economic Assessment Findings
Introduction
This chapter presents the findings of the economic assessment approaches described in Chapter 2 to inform consideration of the indicative value for money of the speed management proposals.
Transport User Impacts
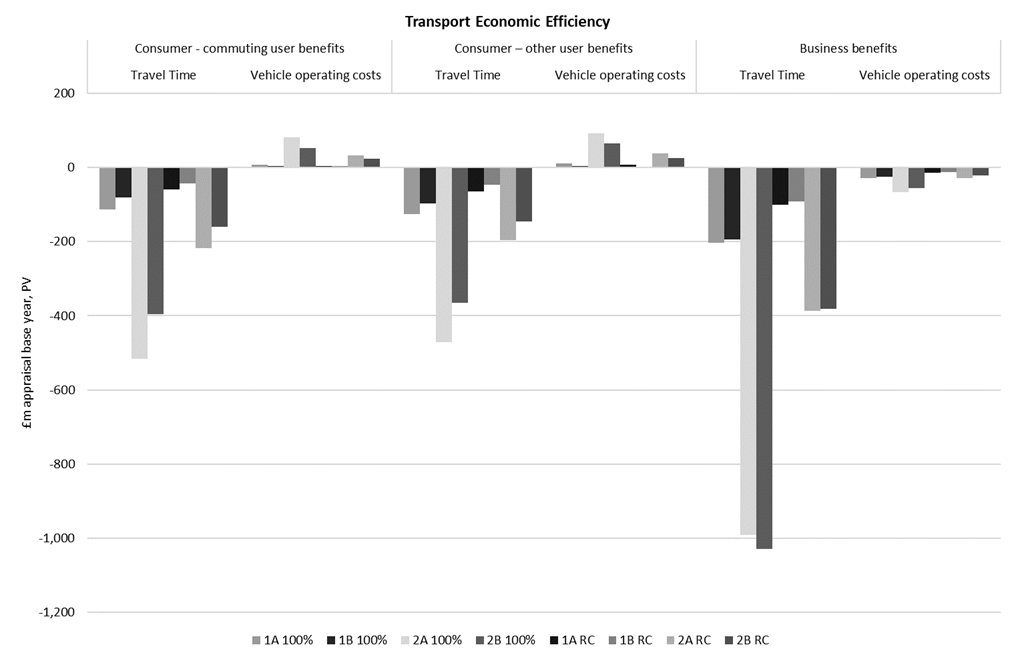
The Transport User Impacts, comprising changes to users’ travel times and vehicle operating costs (fuel and non-fuel), result from a comparison of the costs (in terms of time and money) for the futures with the reference case. As set out below in Table I-5, the change in speed limits increases travel times and vehicle operating costs disbenefits for business users in all scenarios.
Table I-5 – Transport Economic Efficiency (TEE) Benefits (£m, 2010 Prices and Values)
|
Transport Economic Efficiency (TEE) Benefits |
1A 100% |
1B 100% |
2A 100% |
2B 100% |
1A RC |
1B RC |
2A RC |
2B RC |
|
Consumer – commuting user benefits (Travel Time) |
-113 |
-81 |
-516 |
-396 |
-59 |
-42 |
-217 |
-159 |
|
Consumer – commuting user benefits (Vehicle operating costs) |
7 |
4 |
82 |
53 |
4 |
3 |
33 |
24 |
|
Consumer – commuting user benefits (Subtotal) |
-106 |
-77 |
-434 |
-344 |
-55 |
-39 |
-184 |
-136 |
|
Consumer – other user benefits (Travel Time) |
-126 |
-96 |
-470 |
-365 |
-64 |
-47 |
-196 |
-145 |
|
Consumer – other user benefits (Vehicle operating costs) |
11 |
5 |
92 |
65 |
7 |
3 |
38 |
26 |
|
Consumer – other user benefits (Subtotal) |
-116 |
-91 |
-379 |
-300 |
-58 |
-44 |
-158 |
-119 |
|
Business benefits (Travel Time) |
-204 |
-195 |
-992 |
-1,029 |
-100 |
-91 |
-386 |
-381 |
|
Business benefits (Vehicle operating costs) |
-28 |
-24 |
-67 |
-56 |
-14 |
-11 |
-29 |
-21 |
|
Business benefits (Subtotal) |
-231 |
-219 |
-1,059 |
-1,085 |
-114 |
-102 |
-415 |
-402 |
|
Total TEE benefit |
-453 |
-387 |
-1,871 |
-1,728 |
-227 |
-185 |
-757 |
-657 |
Futures 2A and 2B in 100% and realistic compliance with and without policy have the highest overall disbenefits of -£1,871, -£1,728, -£757 and -£657 million respectively. Futures 1A and 1B in 100% and realistic compliance with and without policy scenarios have less overall disbenefits of -£453, -£387, -£227 and -£185 million respectively. presents TEE user benefits by trip purposes for the different scenarios.
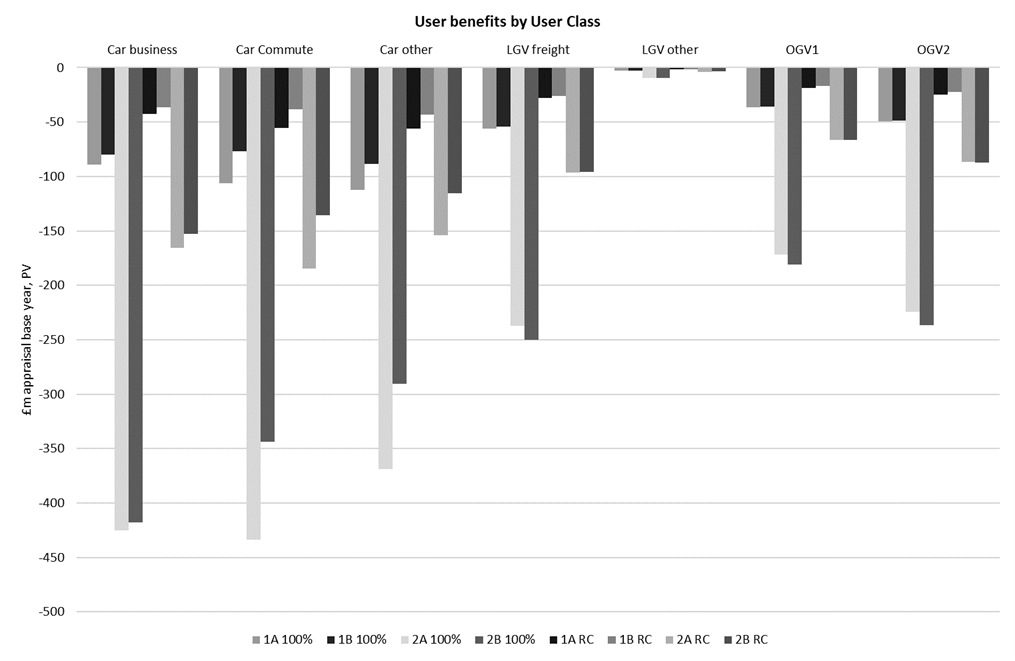
Benefits by User Class
The user benefits have been calculated across different user classes with journey time savings accounting for more than 100% of the total user disbenefit, due to higher journey time disbenefits and benefits in fuel and non-fuel vehicle operating costs by implementing the speed reduction proposal. Travel by car accounts for the largest proportion of user disbenefits across the user classes split between business, commute and other journey purpose categories.
Figure I-2 presents the transport user benefits by user class for different scenarios.
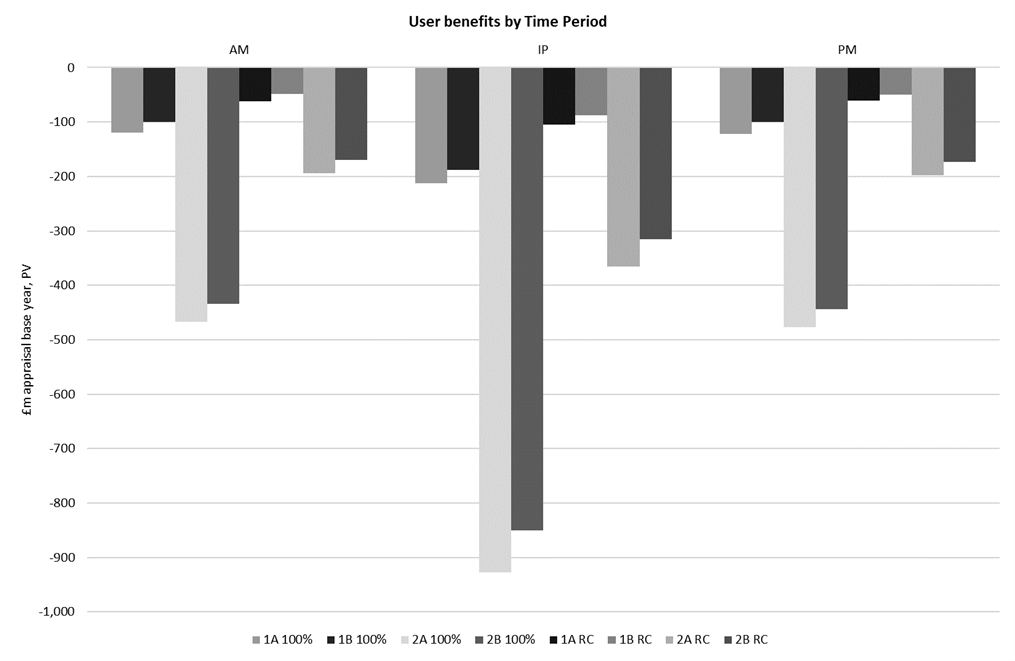
Benefits by Time Period
The total user benefits by time period are provided in Figure I-3 for different scenarios. It shows that the highest user disbenefits are in the IP period, contributing an average of 48% of the total, with the AM and PM periods accounting an average of 26% in each of the total user benefits, respectively.
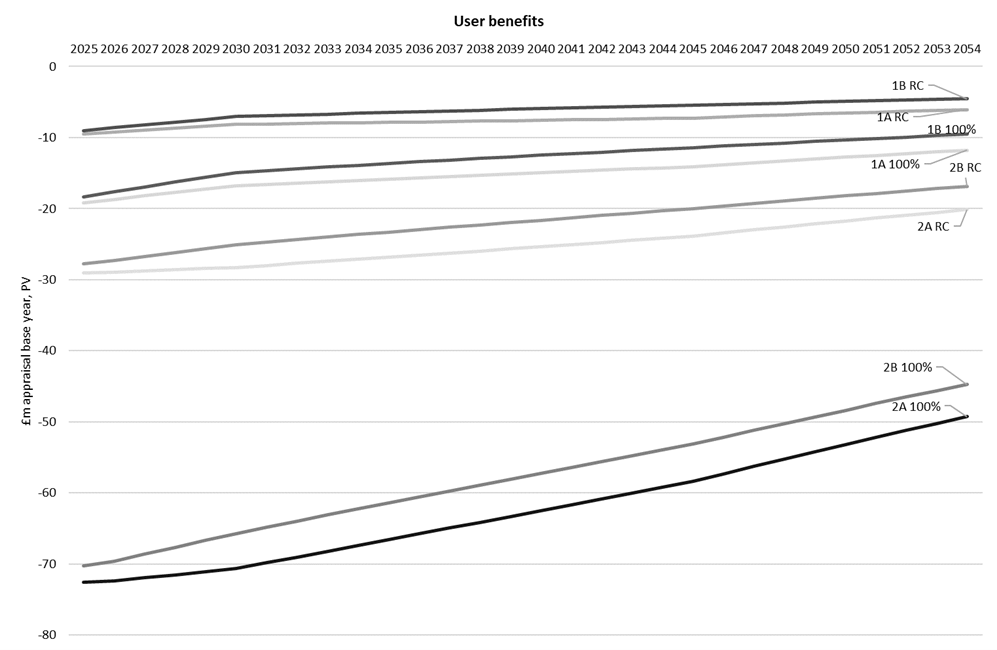
User Benefit Profile over the Appraisal Period
The user benefits over the appraisal period are provided in Figure I-4 for the different scenarios. The option 2 scenarios have the highest level of user disbenefits, with the 100% compliance having greater disbenefit than realistic compliance for both options. The without policy scenarios for both options and levels of compliance have lower disbenefits in comparison with their policy counterparts.
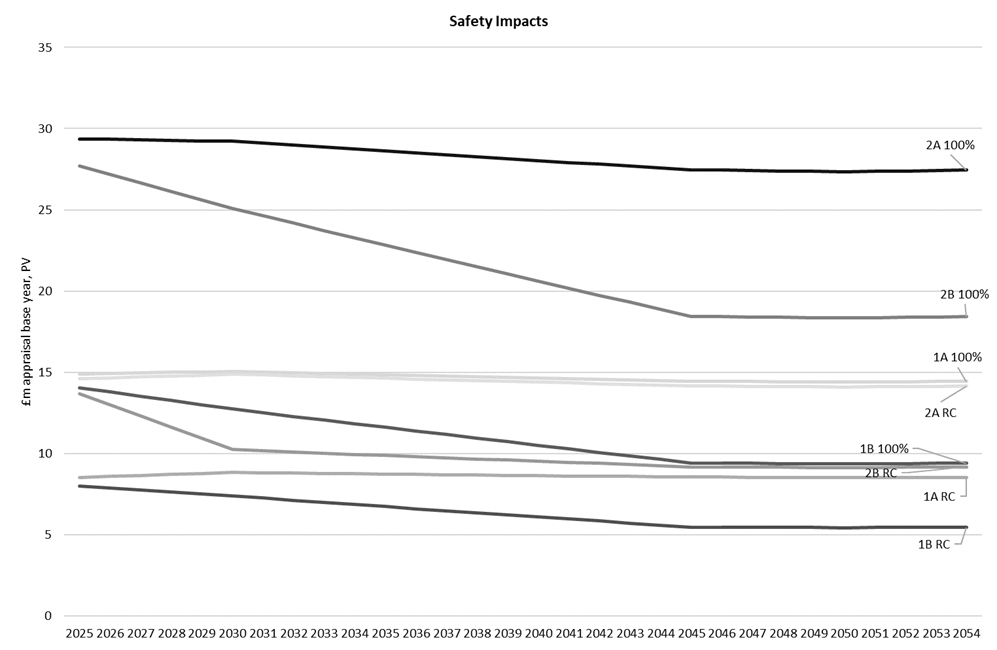
Safety Impacts
The valuation of the safety impacts has been undertaken based on the speed reduction forecast for the scenarios. The results range between £190 to £846 million, as set out in Table I-6.
Table I-6 – Safety Impacts (£m, 2010 prices and values)
|
Components |
1A 100% |
1B 100% |
2A 100% |
2B 100% |
1A RC |
1B RC |
2A RC |
2B RC |
|
Safety Impacts |
440 |
329 |
846 |
646 |
259 |
190 |
433 |
299 |
The safety impacts over the appraisal period are illustrated in Figure I-5 for the different scenarios. The scenarios with 100% compliance have the highest levels of safety benefits and option 2 outperforms option 1. Comparing with and without policy, the former delivers a greater level of benefit.
Further to the evidence from the transport modelling, previous research has found that various speed management measures achieved a reduction in mean speed by -2.4mph to -10mph and reduced person injured accidents (PIAs) by -9% to -58%. Other studies have also reported a reduction in PIAs after the introduction of speed cameras, and associated decreases in mean speeds, ranging from 4% in London to 51% in South Wales.
In Canada, researchers at The Hospital for Sick Children in Toronto identified that when speed limits were reduced from 40kph to 30kph, there was a 28% decrease in the number of collisions between pedestrians and motor vehicles and a 67% decrease in the number of fatal and serious injuries.
Reinforcing the evidence of the relationship between speed and safety, and therefore the benefits of reducing speeds, research has investigated the impacts of increasing the speed limit. This shows that on a high-speed road a 10mph increase in speed limit (e.g. from 55mph to 65mph) is associated with a 3% increase in the number of crashes.
Environmental Damage
Recognising the environmental damage caused by excessive traffic and speeds, speed reduction schemes have been introduced. An example is Epping Forest on the London-Essex border. To mitigate the amount of pollution affecting the forest and to improve road safety the speed limit was reduced from 60mph to 40mph. The measure was introduced following consultation on transport in the forest with residents between 2008 and 2009, with implementation in 2012.
The aim of the scheme was to ensure a consistent driving experience for all road users of the A104 through both the urban and rural environments and improve crossing facilities for non-motorised users. While evidence of the effect of the measures is not available, in recent years there have been proposals to further extend the approach of reducing speed limits on other roads in the area.
Distributional Impacts
Social Impact Assessment Section provides the results of the social and distributional impact assessments. They demonstrate that impacts will be largely neutral for most indicators with slight benefits for accidents reflecting the lower speeds. Also associated with lower speeds is the potential for a slight benefit for journey quality as fear of accidents is reduced and stress from higher speeds is mitigated. The cost of travelling could also reduce as fuel consumption and vehicle wear and tear decreases at lower average speeds.
In relation to the distribution of impacts across protected and vulnerable groups, the assessment indicates that given the nature of the roads for which the proposals are proposed pedestrians and the young and old are unlikely to be significantly affected. However, a reduction in speeds is likely to benefit young male drivers and motorcyclists who are involved in a disproportionate number of accidents. The savings in the cost of driving will notably benefit those in the range from the 20% to 60% most deprived.
To understand localised impacts, an assessment was undertaken to assess the difference in user benefits in terms of journey time across different journeys. The origins and destinations were selected based on areas with a higher proportion of the most deprived population. The results indicate that the journey time increases are unlikely to be noticeable, e.g., less than a minute between Glasgow and Motherwell, up to around 6 minutes between Inverness and Ayr (assuming realistic compliance).
Cost Assessment
Introduction
An estimate has been made of the scale of cost for implementing the speed reduction proposals. These relate to costs associated with construction, design and road authority costs. The cost estimates have been converted to Present Values to reflect the profile of expenditure over time and enable comparison with the values of benefits presented in Chapter 3. The conversion has been calculated in line with TAG A1.2 Scheme Costs (May 2022), which uses the following methodology:
- Estimation of a base cost estimate
- Rebase cost to base year
- Discount cost to base year
- Convert cost to market prices
Estimation of Base Cost Estimate
The initial capital cost of the scheme has been estimated based on current prices. Two cost scenarios have been applied for the route for implementation of the speed reduction proposals. These are:
- Implementation method NL: National legislation change, (with policy).
- Implementation method SL: Change existing statutory legislation (TROs), (without policy).
Cost estimates have been produced for the two speed reduction options, as below:
- Option 1: Reduced National Speed Limit on single-carriageway roads from 60mph to 50mph, all vehicles excluding HGVs; HGVs speed limit increased to 50mph.
- Option 2: Reduced National Speed Limit on single-carriageway roads as for Option 1, plus reduced national limits on dual carriageways including motorways from 70mph to 60mph, all vehicles excluding HGVs; HGVs speed limit increased to 50mph for single carriageway and 60mph for dual carriageway.
The base cost estimates for the two options and the two methods of implementation are set out in Table I-7. The cost estimate for both compliance scenarios (100% and realistic) has been assumed to be the same for appraisal purposes.
Table I-7 – Base Cost Estimates, (£m), in Current Prices
|
Base Costs |
Option 1 NL |
Option 1 SL |
Option 2 NL |
Option 2 SL |
|
Construction Cost |
10.24 |
30.61 |
10.41 |
30.79 |
|
Design Cost |
1.79 |
5.71 |
1.79 |
5.71 |
|
Road Authority Cost |
0.64 |
2.05 |
0.64 |
2.05 |
|
Total |
12.67 |
38.37 |
12.84 |
38.55 |
Scheme Maintenance Cost
In addition to the investment costs comprising the scheme preparation, construction, and road authority costs there will also be maintenance costs. However, it is assumed that these will be the same as the current costs of maintenance and therefore there will be no increase in maintenance costs due to the speed reduction proposals.
Present Value of Costs
To convert the base cost estimates from current to present values the following assumptions and parameters have been applied:
- Costs assumed to increase in-line with general inflation;
- Current prices rebased to 2010 prices, consistent with guidance;
- Values discounted to 2010 at 3.5% per annum, consistent with guidance;
- Market Price adjustment of 19% applied, consistent with guidance; and
- No risk or optimism bias included.
A summary of the results of this cost calculation is shown in Table I-8 to derive the Present Value of Costs (PVC).
Table I-8 – Present Value of Costs (£m, 2010 Prices and Values)
|
Costs |
Option 1 NL |
Option 1 SL |
Option 2 NL |
Option 2 SL |
|
Base cost |
12.67 |
38.37 |
12.84 |
38.55 |
|
Cost with deflation |
8.60 |
25.31 |
8.71 |
25.42 |
|
Cost with discounting |
4.91 |
13.76 |
4.97 |
13.82 |
|
Cost with market price adjustment |
5.84 |
16.37 |
5.92 |
16.45 |
Summary
Analysis of Monetised Costs and Benefits (AMCB) Table
The Analysis of Monetised Costs and Benefits (AMCB) table (presented in Table I-9 and Table I-10 for the with and without policy versions of the scenarios respectively) summarises the monetised impacts of a scheme that are considered sufficiently robust for inclusion in the scheme’s Net Present Value (NPV) and initial Benefit to Cost Ratio (BCR).
The AMCB table combines information from the TEE and Cost tables with monetised estimates of other impacts such as noise, air quality, and accidents. Positive values represent benefits, while negative values represent disbenefits or costs. All values are shown in 2010 prices, discounted to 2010.
Table I-9 – Analysis of Monetised Costs and Benefits (AMCB) Options with Policy Future
|
(£m, 2010 prices and values) |
1A 100% |
2A 100% |
1A RC |
2A RC |
|
Noise |
0 |
0 |
0 |
0 |
|
Local Air Quality |
0 |
0 |
0 |
0 |
|
Greenhouse Gases |
7 |
95 |
4 |
38 |
|
Journey Quality |
0 |
0 |
0 |
0 |
|
Physical Activity |
0 |
0 |
0 |
0 |
|
Accidents |
440 |
846 |
259 |
433 |
|
Economic Efficiency: Consumer Users (Commuting) |
-106 |
-434 |
-55 |
-184 |
|
Economic Efficiency: Consumer Users (Other) |
-116 |
-379 |
-58 |
-158 |
|
Economic Efficiency: Business Users and Providers |
-231 |
-1,059 |
-114 |
-415 |
|
Wider Public Finances (Indirect Taxation Revenues) |
-5 |
-75 |
-3 |
-30 |
|
Present Value of Benefits |
-11 |
-1,005 |
33 |
-316 |
|
Present Value of Costs National Legislation Change |
6 |
6 |
6 |
6 |
|
Present Value of Costs Change existing statutory legislation (TROs) |
16 |
16 |
16 |
16 |
|
Net Present Value National Legislation Change |
-17 |
-1,011 |
27 |
-322 |
|
Net Present Value Change existing statutory legislation (TROs) |
-27 |
-1,021 |
16 |
-333 |
|
Initial BCR National Legislation Change |
-1.8 |
-169.7 |
5.6 |
-53.4 |
|
Initial BCR Change existing statutory legislation (TROs) |
-0.7 |
-61.1 |
2.0 |
-19.2 |
Table I-10 – Analysis of Monetised Costs and Benefits (AMCB) Options without Policy Future
|
(£m, 2010 prices and values) |
1B 100% |
2B 100% |
1B RC |
2B RC |
|
Noise |
0 |
0 |
0 |
0 |
|
Local Air Quality |
0 |
0 |
0 |
0 |
|
Greenhouse Gases |
3 |
72 |
2 |
30 |
|
Journey Quality |
0 |
0 |
0 |
0 |
|
Physical Activity |
0 |
0 |
0 |
0 |
|
Accidents |
329 |
646 |
190 |
299 |
|
Economic Efficiency: Consumer Users (Commuting) |
-77 |
-344 |
-39 |
-136 |
|
Economic Efficiency: Consumer Users (Other) |
-91 |
-300 |
-44 |
-119 |
|
Economic Efficiency: Business Users and Providers |
-219 |
-1,085 |
-102 |
-402 |
|
Wider Public Finances (Indirect Taxation Revenues) |
-2 |
-59 |
-2 |
-25 |
|
Present Value of Benefits (PVB) |
-58 |
-1,069 |
6 |
-352 |
|
Present Value of Costs (PVC) National Legislation Change |
6 |
6 |
6 |
6 |
|
Present Value of Costs (PVC) Change existing statutory legislation (TROs) |
16 |
16 |
16 |
16 |
|
Net Present Value (NPV) National Legislation Change |
-64 |
-1,075 |
0 |
-358 |
|
Net Present Value (NPV) Change existing statutory legislation (TROs) |
-74 |
-1,085 |
-11 |
-369 |
|
Initial BCR National Legislation Change |
-9.9 |
-180.5 |
1.0 |
-59.5 |
|
Initial BCR Change existing statutory legislation (TROs) |
-3.5 |
-65.0 |
0.3 |
-21.4 |
Based on the AMCB, the total monetised benefits are positive for option 1 realistic compliance with policy changes future (£33m PV) and without policy changes future (£6m PV) due to the accident savings outweighing the journey time disbenefits. For the rest of the futures disbenefits are forecast with them being greatest for option 2 100% compliance.
With a Net Present Value (NPV) above zero for option 1 realistic compliance with policy, it is estimated to achieve benefit to cost ratios (BCR) between 2 and 5.6 depending on the method of implementation. For the comparable without policy scenarios the BCRs range between 0.3 and 1. All other futures are estimated to deliver a negative NPV and negative BCR.
Value for Money
The initial BCRs range from 5.6 to -180.5, depending on the futures and implementation approach assumed. This implies the propose could achieve value for money ranging from Very High to Very Poor on the basis of initial BCR impacts.
The highest levels of value for money are achieved by option 1 with proposals for speed reduction on single-carriageway roads and assuming realistic compliance. The case is stronger with the assumption that wider policy interventions are made.
Social and Distributional Impact Report
Social Impact Assessment
Introduction
Social impacts consider the overall impact of transport interventions on different indicators like accidents, physical activity, security, severance, journey quality, option and non-use value and accessibility. Both beneficial and/or adverse impacts of transport interventions are considered, along with the identification of social groups likely to be affected. The qualitative assessments based on all indicators are detailed below.
Accidents
Option 1 and 2 are expected to result in decreased speeds for cars on single and dual carriageway roads and on motorways. This reduction is anticipated to lower the number of collisions, as slower speeds decrease accident risks and may lower the mortality rates.
Table I-11 summarises the reductions estimated in accidents for each of the futures from the Elvik accident calculations.
Table I-11 – Reduction in Forecasted Accident Numbers
|
Components |
1A 100% |
1B 100% |
2A 100% |
2B 100% |
1A RC |
1B RC |
2A RC |
2B RC |
|
Total reduction in accident numbers |
-48 |
-45 |
-99 |
-94 |
-26 |
-25 |
-47 |
-44 |
Option 1A is expected to save a moderate number of collisions each year when the scheme is operational. This impact is based on a realistic compliance future.
Option 1B shows slight reduction in the number of collisions saved as compared to Option 1A because of the lower number of trips resulting from the future policy.
Option 2 (Both A and B) shows the maximum reduction in the forecasted collisions due to the increased number of roads (Single and dual carriageways and motorways) having a speed reduction within Option 2.
For both the options, the scheme would be expected to have a higher impact on collision savings under a 100% compliance future as compared to realistic future.
Table I-12 summarises the accident benefits discounted to 2010 prices and for an appraisal period of 30 years arising from the Elvik accident calculations.
Table I-12 – Accident benefits summary
|
Scenario |
Description |
Benefits in millions |
|
1a 100% |
Option 1, without policy and 100% compliance |
£440.5 |
|
1a RC |
Option 1, without policy and realistic compliance |
£329.1 |
|
1b 100% |
Option 1, with policy and 100% compliance |
£846.4 |
|
1b RC |
Option 1, with policy and realistic compliance |
£646.4 |
|
2a 100% |
Option 2, without policy and 100% compliance |
£258.8 |
|
2a RC |
Option 2, without policy and realistic compliance |
£190.3 |
|
2b 100% |
Option 2, with policy and 100% compliance |
£432.9 |
|
2b RC |
Option 2, with policy and realistic compliance |
£299.1 |
Since the scheme proposes speed restrictions on strategic key roads such as A roads and motorways, where cyclist and pedestrian activities involving vulnerable social groups are rare, the benefits accrued by vulnerable social groups will be minimal.
Hence, for the DI assessment, Option 1A and Option 2A are assessed as Neutral. Option 1B and Option 2B are assessed as Slight Beneficial as the policy could reduce the number of vehicles on the carriageway which when coupled with the speed reduction increases safety.
Physical Activity
There is the potential for an increased perception of safety for active travel users where the speed limit has been reduced leading to an increase in active travel journeys for shorter distance trips. For some longer distance trips modal shift to rail may encourage the use of active travel to access stations. Together these may provide health benefit to users who previously did not make these journeys by active travel; however it is anticipated to be negligible or very small given the speeds of motor vehicles will remain high and the shift to rail will be limited. Therefore, a score of Neutral is anticipated for all the futures.
Security
The scheme focuses on speed reduction of cars and does not have any impact on the pedestrian access, public transport facilities, provision of lighting, surveillance etc. Therefore, the security indicator has not been appraised for this scheme.
Severance
Severance is defined as the separation of residents from facilities and services they use within their community, caused by substantial changes in transport infrastructure or by changes in traffic flows. Severance is only an issue where either vehicle flows are significant enough to significantly impede pedestrian movement or where infrastructure presents a physical barrier to movement.
Severance primarily concerns those using non-motorised modes, particularly pedestrians and is thus particularly relevant to the scheme area. The scheme proposes to reduce the speed thus improving the perception of safety and will reduce levels of congestion as perceived barriers to travel. This means that the scheme will reduce existing levels of severance rather than impose higher levels of severance on more vulnerable social groups such as the disabled population, children below 16 years and older people, who would access the amenities by foot.
As the scheme is focussed on single and dual carriageways as well as motorways, the activities involving pedestrians are less distributed around these roads, thus limiting the distribution of benefits.
As per TAG Unit A 4.1, Table 5.1, without scheme severance is scored as Moderate and with scheme scoring is also Moderate in areas where there are single and dual carriageway roads, thus making the assessment Neutral for all futures.
Journey Quality
Journey quality is a measure of the real and perceived physical and social environment experienced while travelling. This includes factors such as public information provision, perceptions of safety (e.g. street lighting, CCTV cameras, pedestrian and cycle infrastructure) and provision for enhanced accessibility.
Journey quality impacts can be sub-divided into three groups, according to their nature:
- Traveller care: aspects such as cleanliness, level of facilities, information and the general transport environment.
- Travellers’ views: the view and pleasantness of the external surroundings in the duration of the journeys.
- Traveller stress: frustration, fear of accidents and route uncertainty.
The reduction in speed limit is expected to reduce overall accidents on roads in Scotland. Furthermore, there may also be a reduction in queuing at junctions, which will result in a reduction in idling time and reduce driver frustration. As such, a positive impact on Travellers’ Stress is anticipated as the scheme will help avoid frustration, fear of accidents of travellers and route uncertainty, leading to a Slight Beneficial impact for all futures.
Option Values and Non-Use Values
Option and non-use values should be assessed if the scheme being appraised includes measures that will substantially change the availability of existing transport services within the study area (e.g. closure/opening of a rail or bus service). As this scheme is focused on speed limit changes, it is not expected to change the availability of transport services within the area.
Therefore, the option values and non-use values impacts have not been appraised for this scheme.
Accessibility
According to TAG unit A4.1, accessibility is a term that has a multitude of meanings within the transport profession ranging from the physical access onto a public transport vehicle, the ability to get to a given place (for example a hospital), to the accessibility of information about a particular public transport service.
It is not anticipated that the scheme will materially impact local bus services given their routes and average speeds and therefore the scheme will not bring about changes to public transport in the form of rerouting, service timings, frequency or changes to the waiting facilities. Therefore, a Neutral impact is anticipated for all the futures.
Personal Affordability
Personal affordability impacts, in the case of most transport infrastructure improvement schemes, may arise as an indirect consequence of the intervention.
Slower speeds generally enhance fuel efficiency in vehicles. At reduced speeds, vehicles consume less fuel per mile, which translates into cost savings on fuel for individuals who depend on personal vehicles. This will particularly have a benefit to the vulnerable social groups who belong to the economically deprived category. This group of population would find it easier to afford a car journey leading to Slight Beneficial impact for all the futures.
Summary
A summary of the Social Impact Assessment is provided in Table I-13 below.
Table I-13 – Summary of Social Impacts
|
Impact |
Social Impact Scoring |
|
Accidents |
Neutral for Option 1A and Option 2A, Slight Beneficial for Option 1B and Option 2B |
|
Physical Activity |
Neutral |
|
Security |
Not appraised |
|
Severance |
Neutral |
|
Journey Quality |
Slight Beneficial |
|
Option Values and Non-Use Values |
Not appraised |
|
Accessibility |
Neutral |
|
Personal Affordability |
Slight Beneficial |
Distributional Impacts
Overview
Distributional Impacts (DI) consider the variance of transport intervention impacts on different social groups. The DI appraisal process involves the following steps:
Screening Process:
- Identification of likely impacts for each indicator.
Assessment:
- Confirmation of the area impacted by the transport intervention (impact area);
- Identification of social groups in the impact area; and
- Identification of amenities in the impact area.
Appraisal of impacts:
- Core analysis of the impacts; and
- Full appraisal of DIs.
The appraisal of DI focuses on eight specific impacts, as detailed here.
The Eight Social and Distributional Impacts
User Benefits (TAG Unit A4.2.2)
It is important to gain an understanding of the distribution of user benefits by social group and by area. This analysis assists in understanding how user benefits accrue to different groups in society and across a geographic area. Analysing a wider area outside of the immediate vicinity of the intervention is vital as user benefits are often generated significantly beyond the immediate area of the scheme.
Note that DI analysis is only applicable for individuals and not in-work trips experienced by businesses.
Noise (TAG Unit A4.2.3)
It is important to understand the distributional effects of changes to noise generated by the transport intervention – both in terms of improvements and deterioration. Changes in noise levels resulting from the intervention will be experienced to varying extents in different areas and by different groups of people. It is therefore important to understand the noise-related social and distributional impacts of a scheme
Air Quality (TAG Unit A4.2.4)
Changes in emission levels resulting from the transport intervention will vary by location and social group. It is therefore important to understand the distribution of air quality changes – both in terms of improvements and deteriorations.
Accidents (TAG Unit A4.2.5)
Transport schemes can have significant impacts on safety and accidents and as these issues can have varying impacts on different areas and social groups, it is important to understand the specific impacts of an individual scheme.
Severance (TAG Unit A4.2.6)
Transport interventions can result in changes to levels of severance within the transport network through influencing traffic flows and providing new infrastructure. As severance issues impact on different social groups and areas to differing extents, it is important to analyse how individual scheme will alter levels of severance.
Security (TAG Unit A4.2.7)
Transport schemes can have impacts on personal security (both real and perceived) and these benefits can differ according to area and social group. It is therefore important to gain an understanding of the social and distributional impacts of the transport intervention from the personal security perspective.
Accessibility (TAG Unit A4.2.8)
Access to services often presents significant difficulties to certain social groups and those living remotely. Transport interventions can have an impact of the ability of people to access services they require.
Personal Affordability (TAG Unit A4.2.9)
Changes in costs (both increases and reductions) need to be assessed in terms of understanding the social and distributional effects. Any changes in transport costs due to changes to the transport network could impact on lower income groups.
The findings from the initial screening identify which indicators should be appraised in more detail and provide recommendations, where appropriate for further analysis. The screening proforma is summarised in Table I-14 below and detailed screening comments are provided in each of their respective sections.
The screening process found that no further assessment was required for security as the scheme is not anticipated to have any impact on public transport security through a change in public transport waiting/interchange facilities or access to such facilities which would likely affect user perceptions of personal security (the focus on the impact analysis method described in TAG).
Similarly, no further assessment was required for accessibility because the scheme does not bring about changes to public transport in the form of rerouting, timings, frequency, or changes to the waiting facilities.
Table I-14 – Summary of Proforma
|
DI Indicator |
Likely DI Impact |
Recommendation |
|
User Benefits |
Yes |
Proceed to Step 2 |
|
Noise |
Yes |
Proceed to Step 2 |
|
Air Quality |
Yes |
Proceed to Step 2 |
|
Accidents |
Yes |
Proceed to Step 2 |
|
Severance |
Yes |
Proceed to Step 2 |
|
Security |
No |
No further assessment |
|
Accessibility |
No |
No further assessment |
|
Affordability |
Yes |
Proceed to Step 2 |
Following the screening exercise, all the above indicators have been taken forward to Step 2 for further assessment. Table I-15 sets out the groups of people identified in the analysis for each of the indicators.
Table I-15 – Social Groups and DI Indicators
|
Dataset / Social Group |
User Benefits |
Noise |
Air Quality |
Accidents |
Severance |
Security |
Accessibility |
Personal Affordability |
|
Income Distribution |
Yes |
Yes |
Yes |
No |
No |
No |
Yes |
Yes |
|
Children (proportion of population aged under 16) |
No |
Yes |
Yes |
Yes |
Yes |
Yes |
Yes |
No |
|
Young Adults (proportion of population aged 16-25 |
No |
No |
No |
Yes |
No |
No |
Yes |
No |
|
Older People (proportion of population aged over 70) |
No |
Yes |
No |
Yes |
Yes |
Yes |
Yes |
No |
|
Proportion of population with a disability |
No |
No |
No |
No |
Yes |
Yes |
Yes |
No |
|
Proportion of population of Black and Minority Ethnic (BME) origin |
No |
No |
No |
No |
No |
Yes |
Yes |
No |
|
Proportion of households without access to a car |
No |
No |
No |
No |
Yes |
No |
Yes |
No |
|
Carers (proportion of households with dependent children) |
No |
No |
No |
No |
No |
No |
Yes |
No |
Table I-16 sets out the general scoring method of distributional impacts for identified social groups.
Table I-16 – General System for Grading of Distributional Impacts for each of the Identified Social Groups
|
Impact |
Assessment |
|
Beneficial and the population impacted is significantly greater than the proportion of the group in the total population |
Large Beneficial |
|
Beneficial and the population impacted is broadly in line with the proportion of the group in the total population |
Moderate Beneficial |
|
Beneficial and the population impacted is smaller than the proportion of the group in the total population |
Slight Beneficial |
|
There are no significant benefits or disbenefits experienced by the group for the specified impact |
Neutral |
|
Adverse and the population impacted is smaller than the proportion of the group in the total population |
Slight Adverse |
|
Adverse and the population impacted is broadly in line with the proportion of the group in the total population |
Moderate Adverse |
|
Adverse and the population impacted is significantly greater than the proportion of the group in the total population |
Large Adverse |
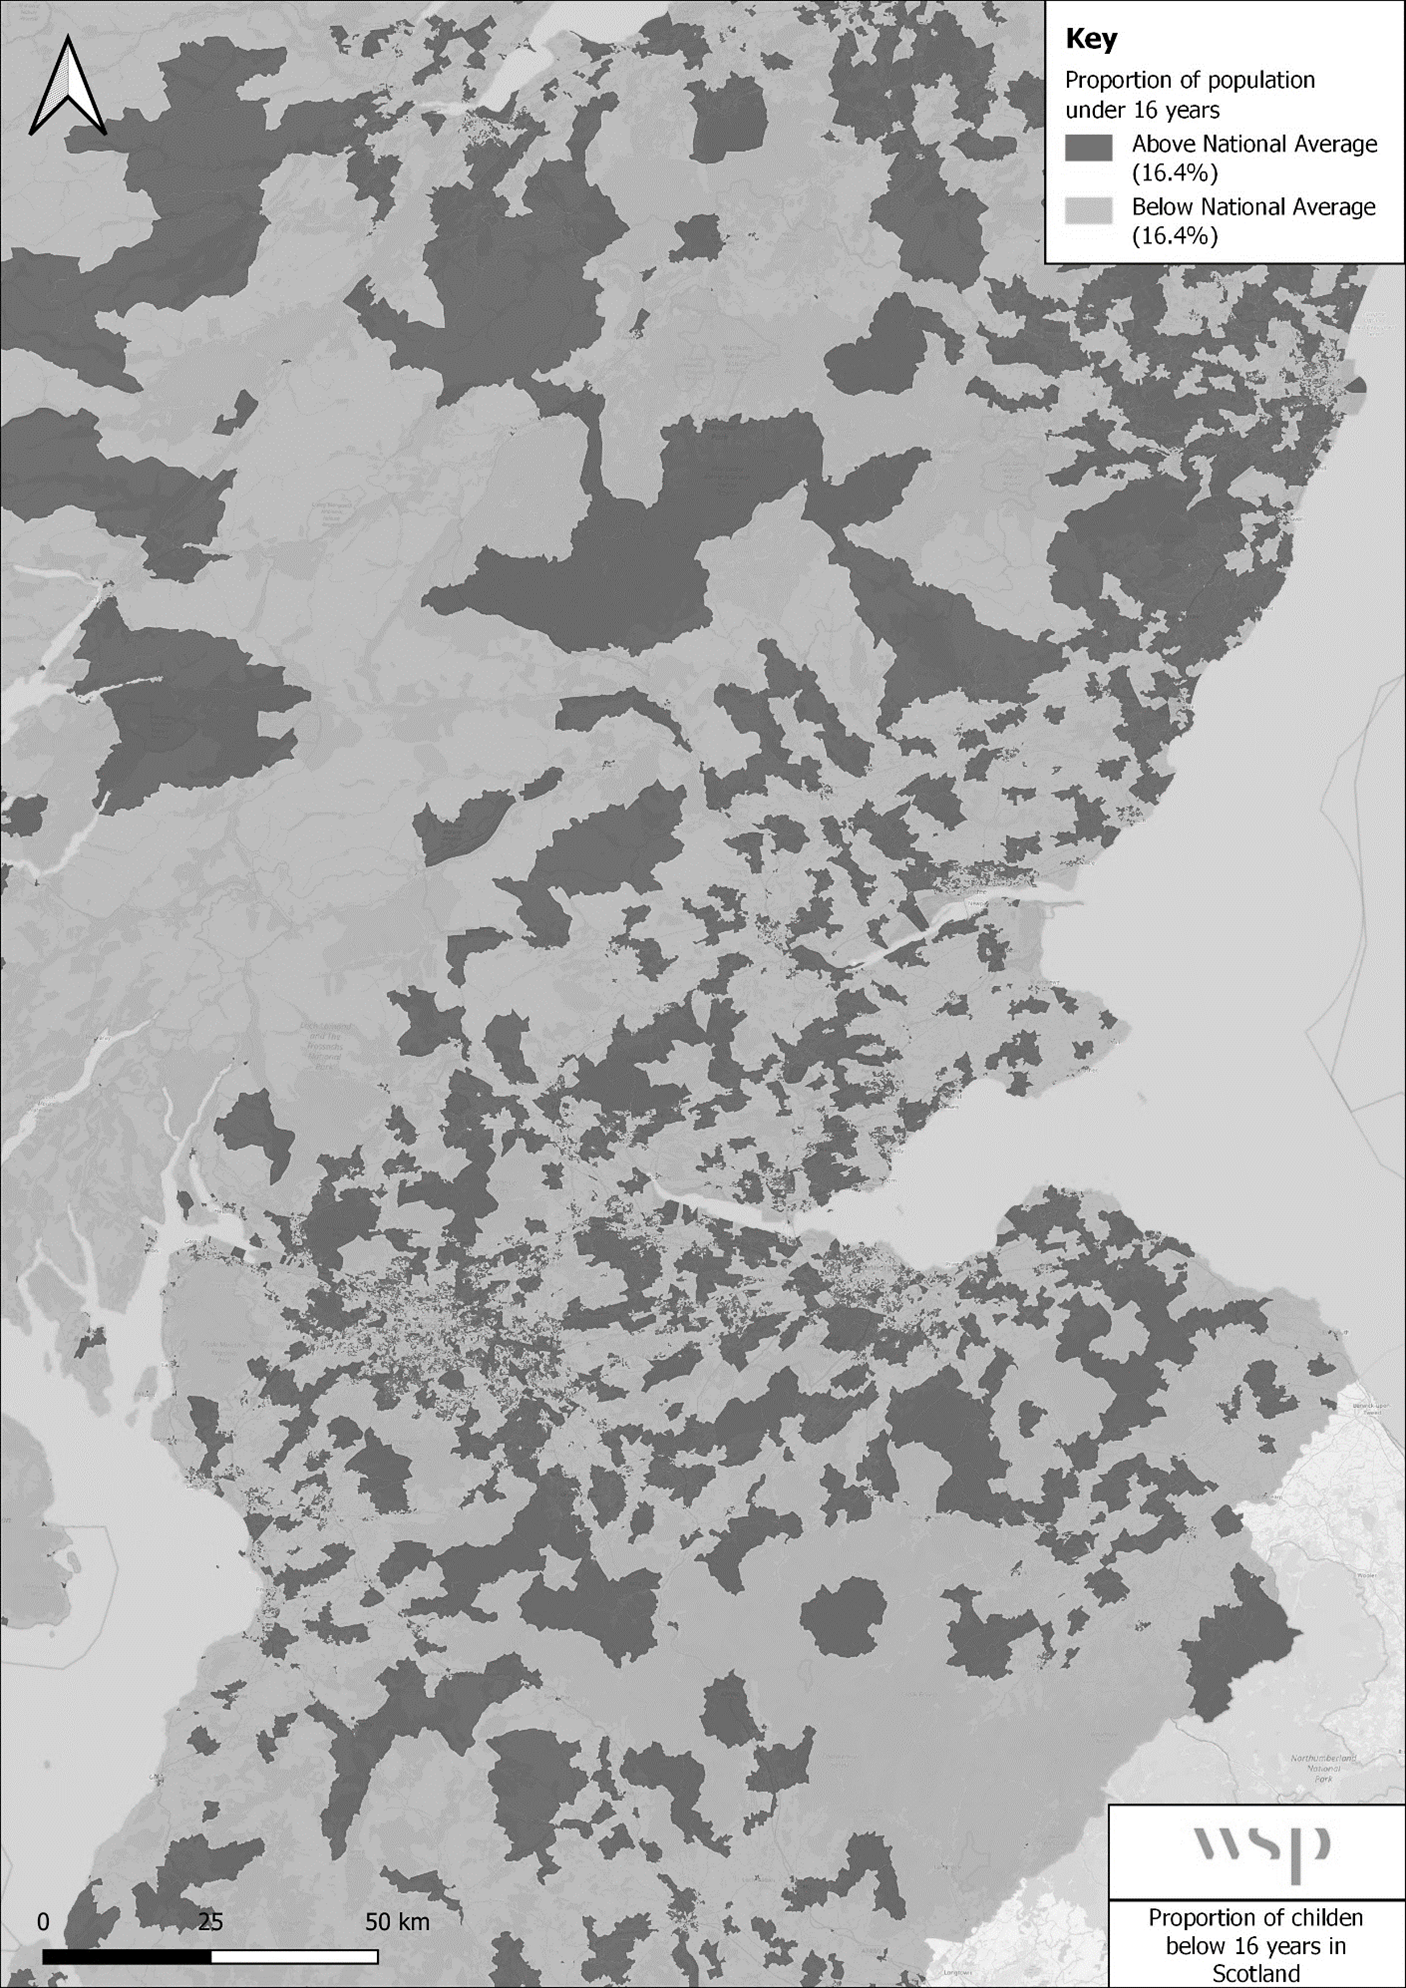
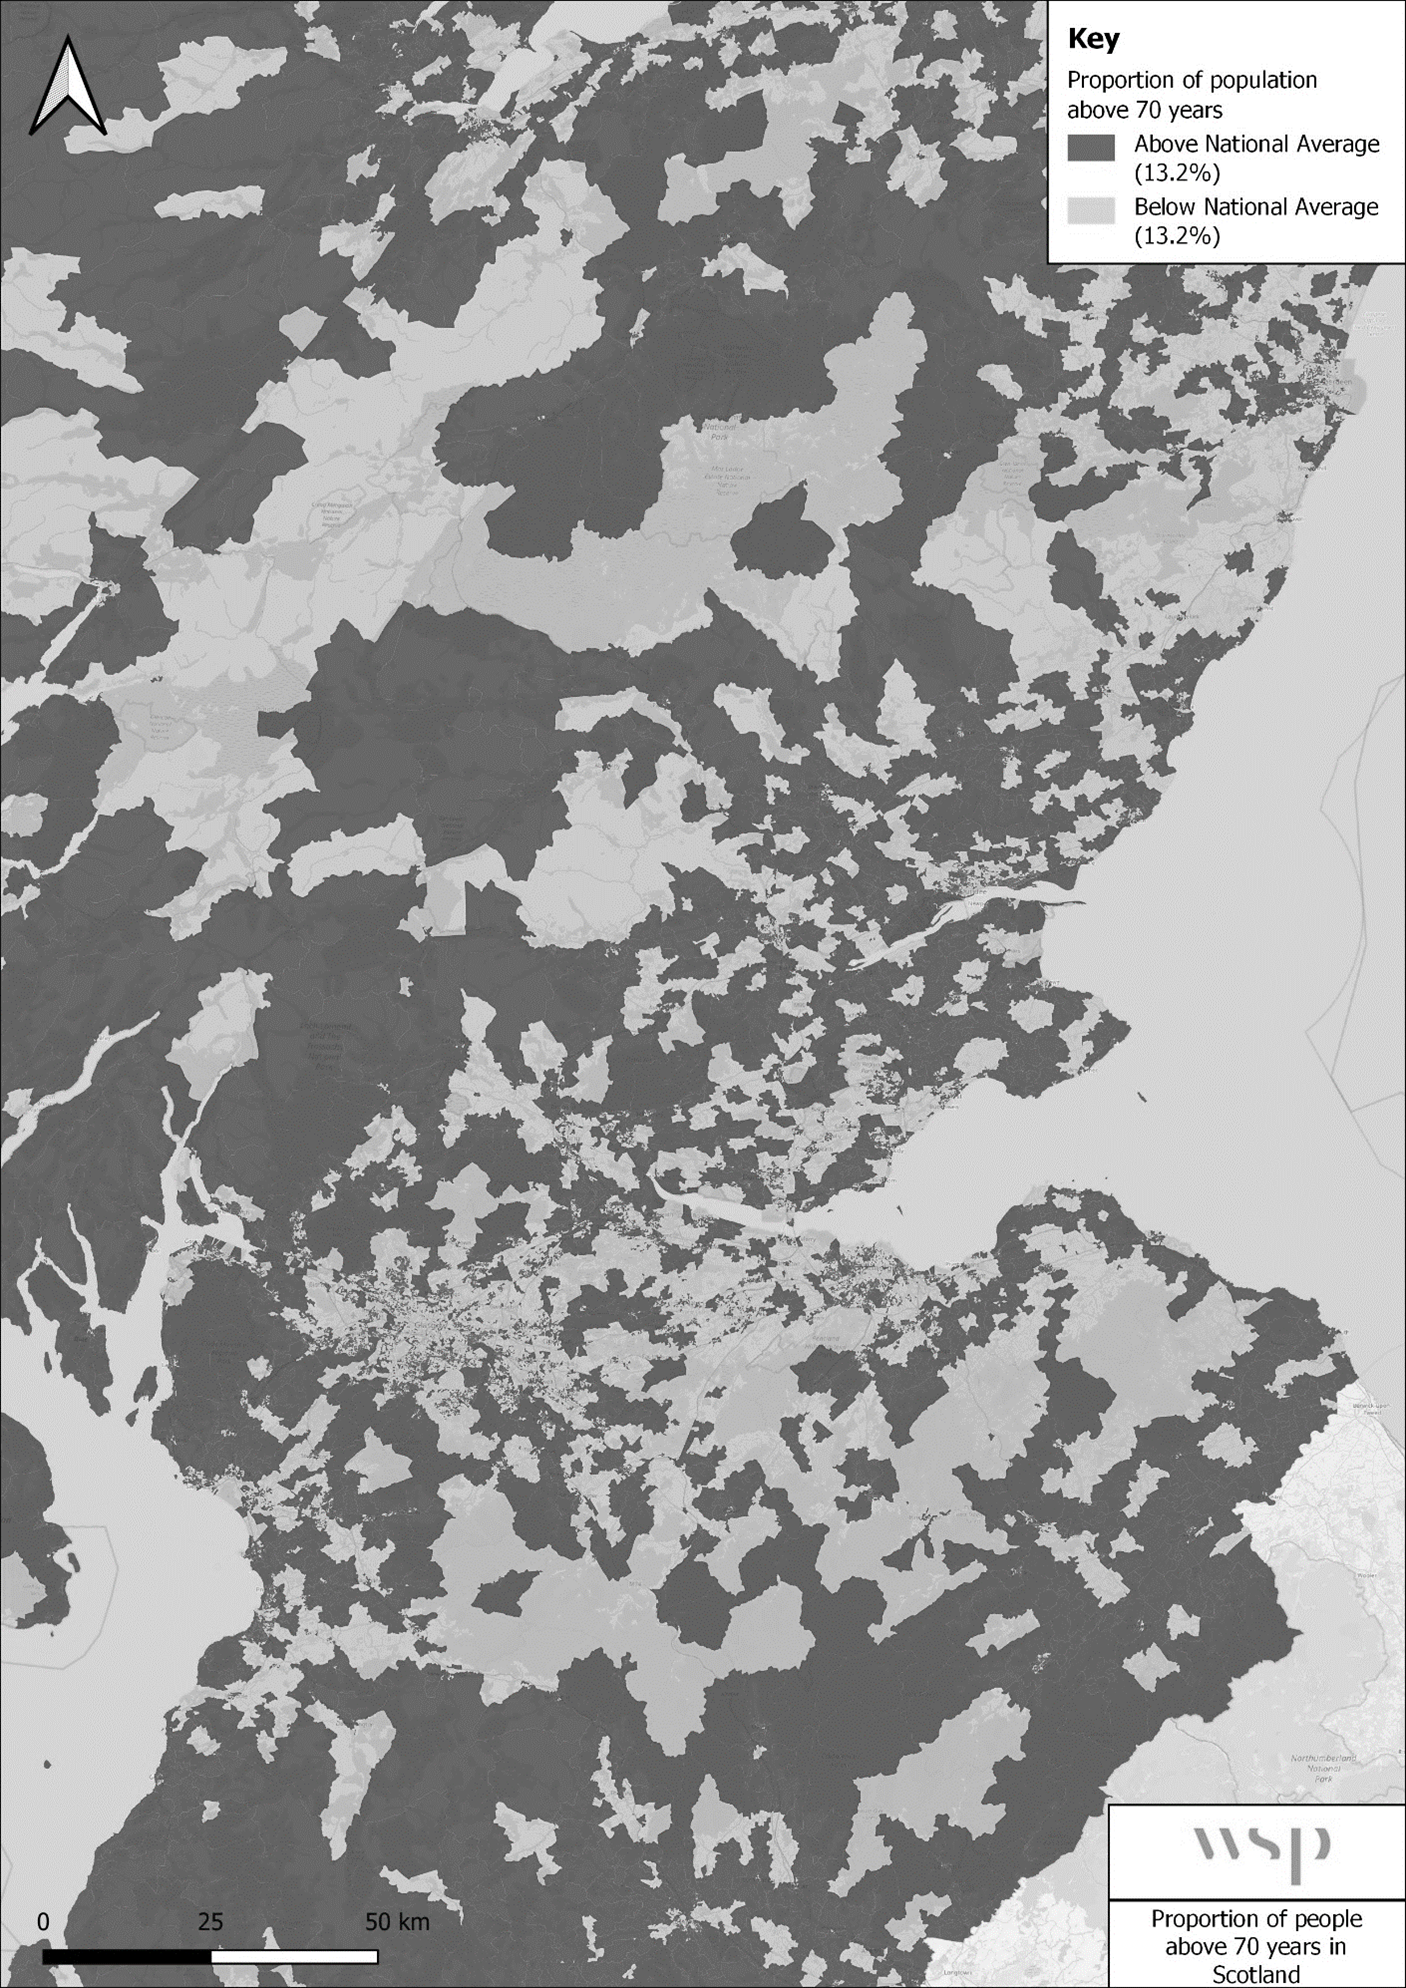
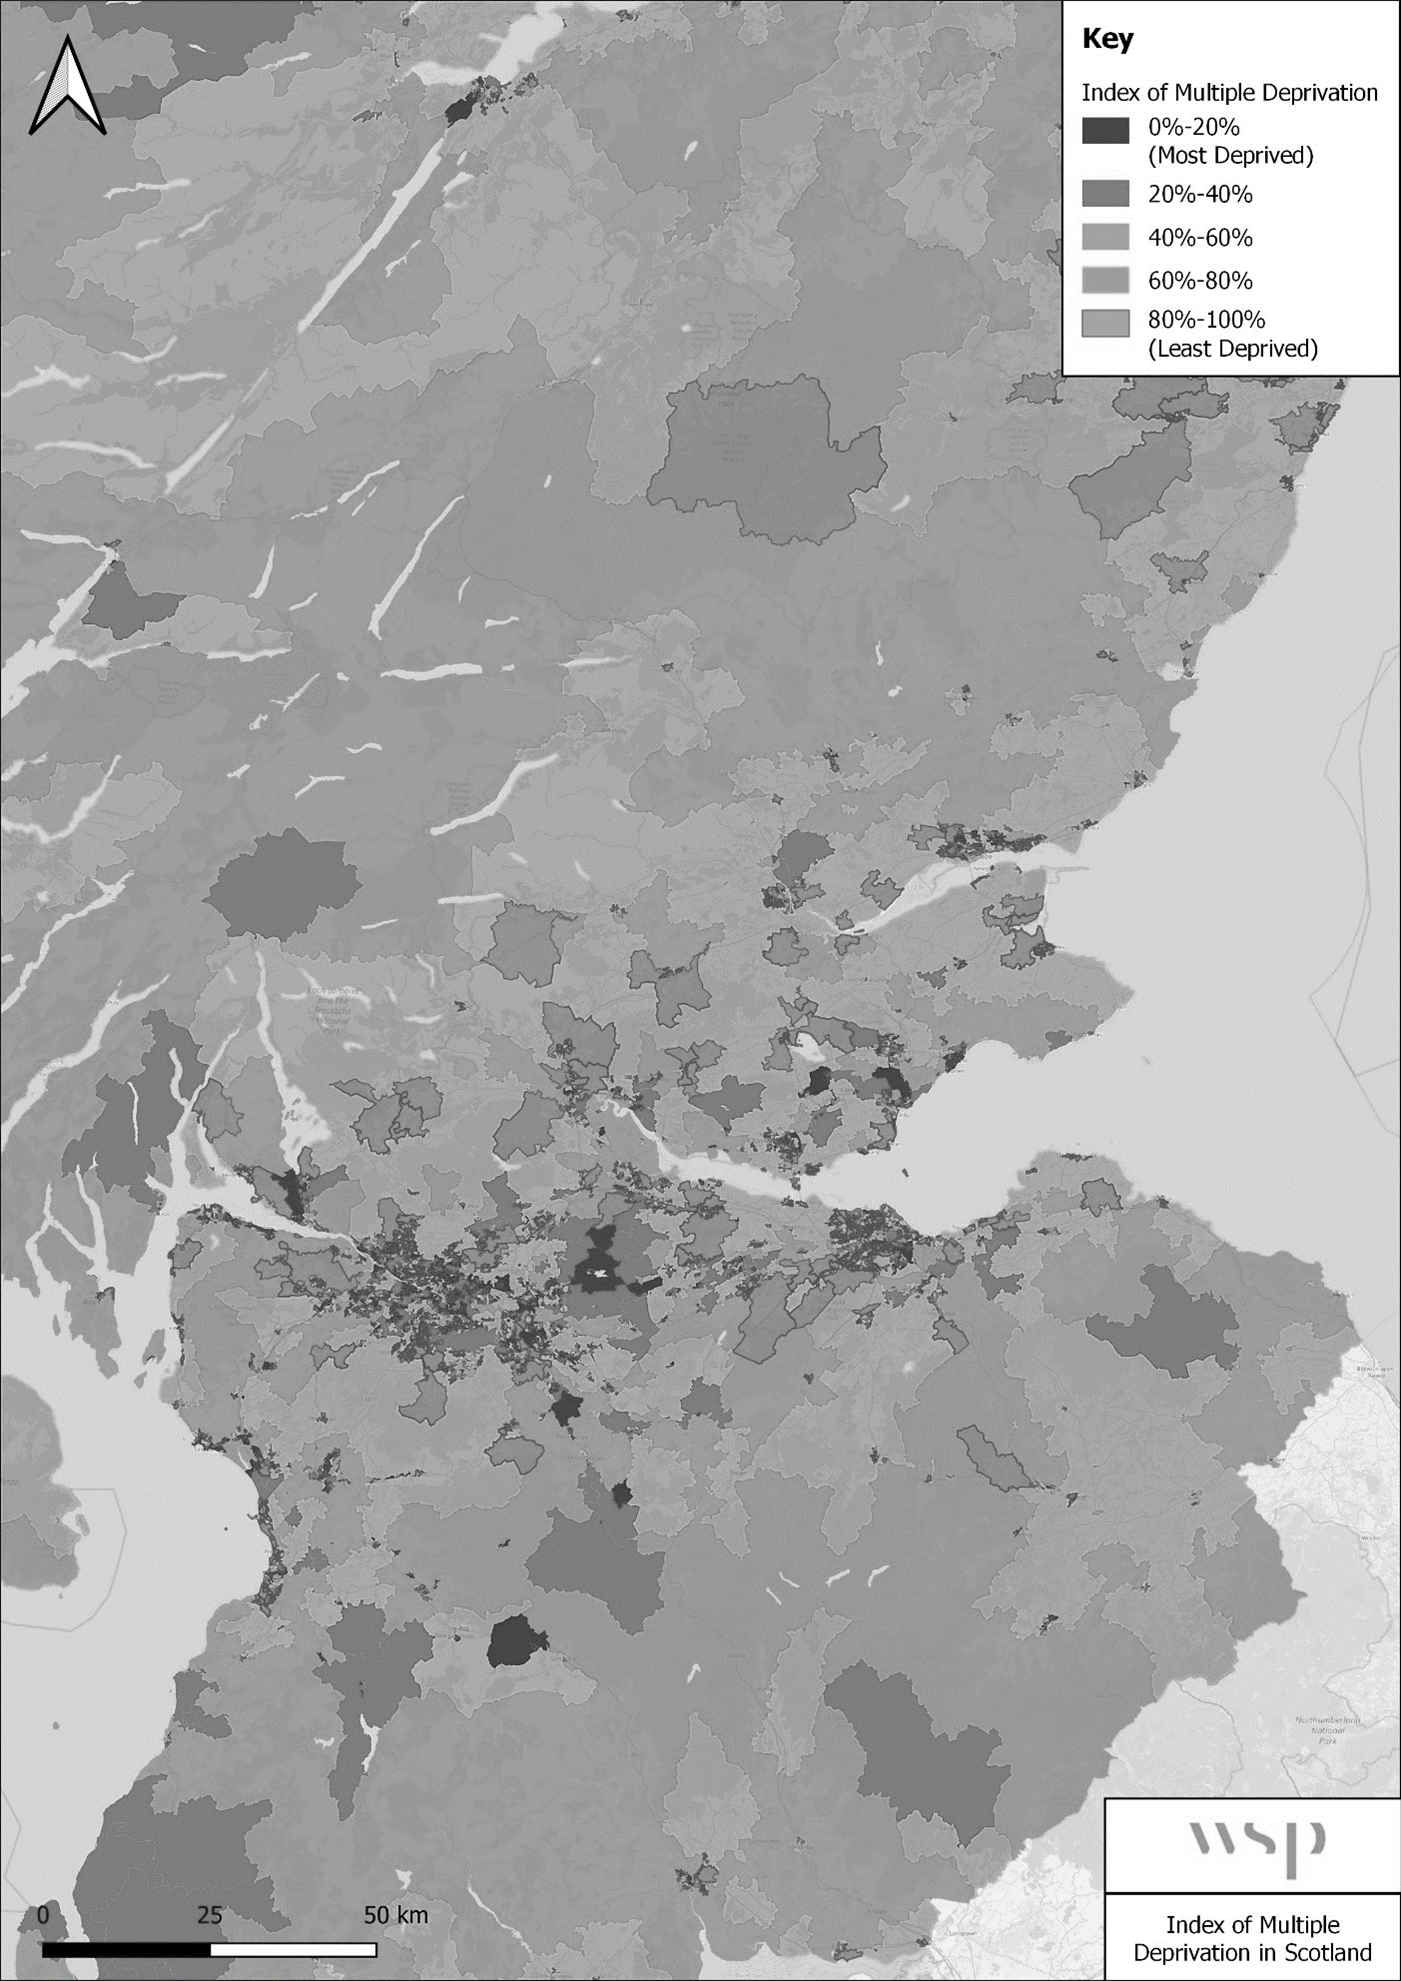
Figure I-6 and Figure I-10 below provide a visual representation of output areas within Scotland with higher or lower than the national average proportions of children below 16 years and older people above 70 years respectively. Figure I-8 shows the distribution of deprivation (based on the “Index of Multiple Deprivation”) for data zones within Scotland. These datasets have been assessed in detail to come up with the DI scoring of each indicator.
User Benefits
User benefits of transport schemes are experienced differently by different social groups geographically. The distributional impact analysis of user benefits is described below.
Screening
The scheme is anticipated to demonstrate an overall economic disbenefit. Reduced speed limits for most vehicles will increase journey times. A quantitative assessment of the scheme’s impacts on vulnerable groups has been carried out.
Assessment
The monetised impact values obtained from TUBA have been extracted for every model sector in the impact area. For the purpose of the DI appraisal, only non-business user benefits have been included with AM peak origin benefits and the PM peak destination benefits used for spatial allocation, in line with TAG. Interpeak (IP) benefits use both the origin and destination benefits from each zone divided into two, so that the total accrual of benefits is not double counted.
TUBA was undertaken for option 1 and option 2 for scenarios involving “With” and “Without Policy” and 100% and Realistic Compliance of each, thus giving a total of eight futures.
Table I-17 summarises the disbenefits for non-business users discounted to 2010 prices and for an appraisal period of 30 years as produced from TUBA.
Table I-17 – User disbenefits for each of the scenarios modelled
|
Scenario |
Description |
Benefits in millions |
|
1a 100% |
Option 1, without policy and 100% compliance. |
-£218.67 |
|
1a RC |
Option 1, without policy and realistic compliance. |
-£161.06 |
|
1b 100% |
Option 1, with policy and 100% compliance. |
-£835.20 |
|
1b RC |
Option 1, with policy and realistic compliance. |
-£644.57 |
|
2a 100% |
Option 2, without policy and 100% compliance. |
-£113.06 |
|
2a RC |
Option 2, without policy and realistic compliance. |
-£81.07 |
|
2b 100% |
Option 2, with policy and 100% compliance. |
-£355.17 |
|
2b RC |
Option 2, with policy and realistic compliance. |
-£259.61 |
TUBA outputs were disaggregated into eight sectors which together span the whole of Scotland and all the sectors have reported disbenefits. Table I-18 summarises the IMD level in the sectors. This classification helps in understanding the distribution of disbenefits across different levels of deprivation within each sector. Figure I-9 below shows the graphical representation of distribution in each modelled sector.
Table I-18 – Sector Wise Summary
|
Sectors |
0%-20% (Most deprived) |
20%-40% |
40%-60% |
60%-80% |
80%-100% (Least deprived) |
|
1-Highlands & Islands |
1% |
18% |
66% |
14% |
1% |
|
2-North East Scotland |
11% |
16% |
21% |
27% |
25% |
|
3-Mid Scotland and Fife |
13% |
16% |
24% |
28% |
19% |
|
4-West Scotland |
22% |
17% |
15% |
19% |
27% |
|
5-Glasgow |
43% |
17% |
13% |
13% |
13% |
|
6-Central Scotland |
24% |
25% |
18% |
17% |
16% |
|
7-Lothians |
12% |
19% |
17% |
19% |
34% |
|
8-South of Scotland |
15% |
23% |
32% |
19% |
12% |
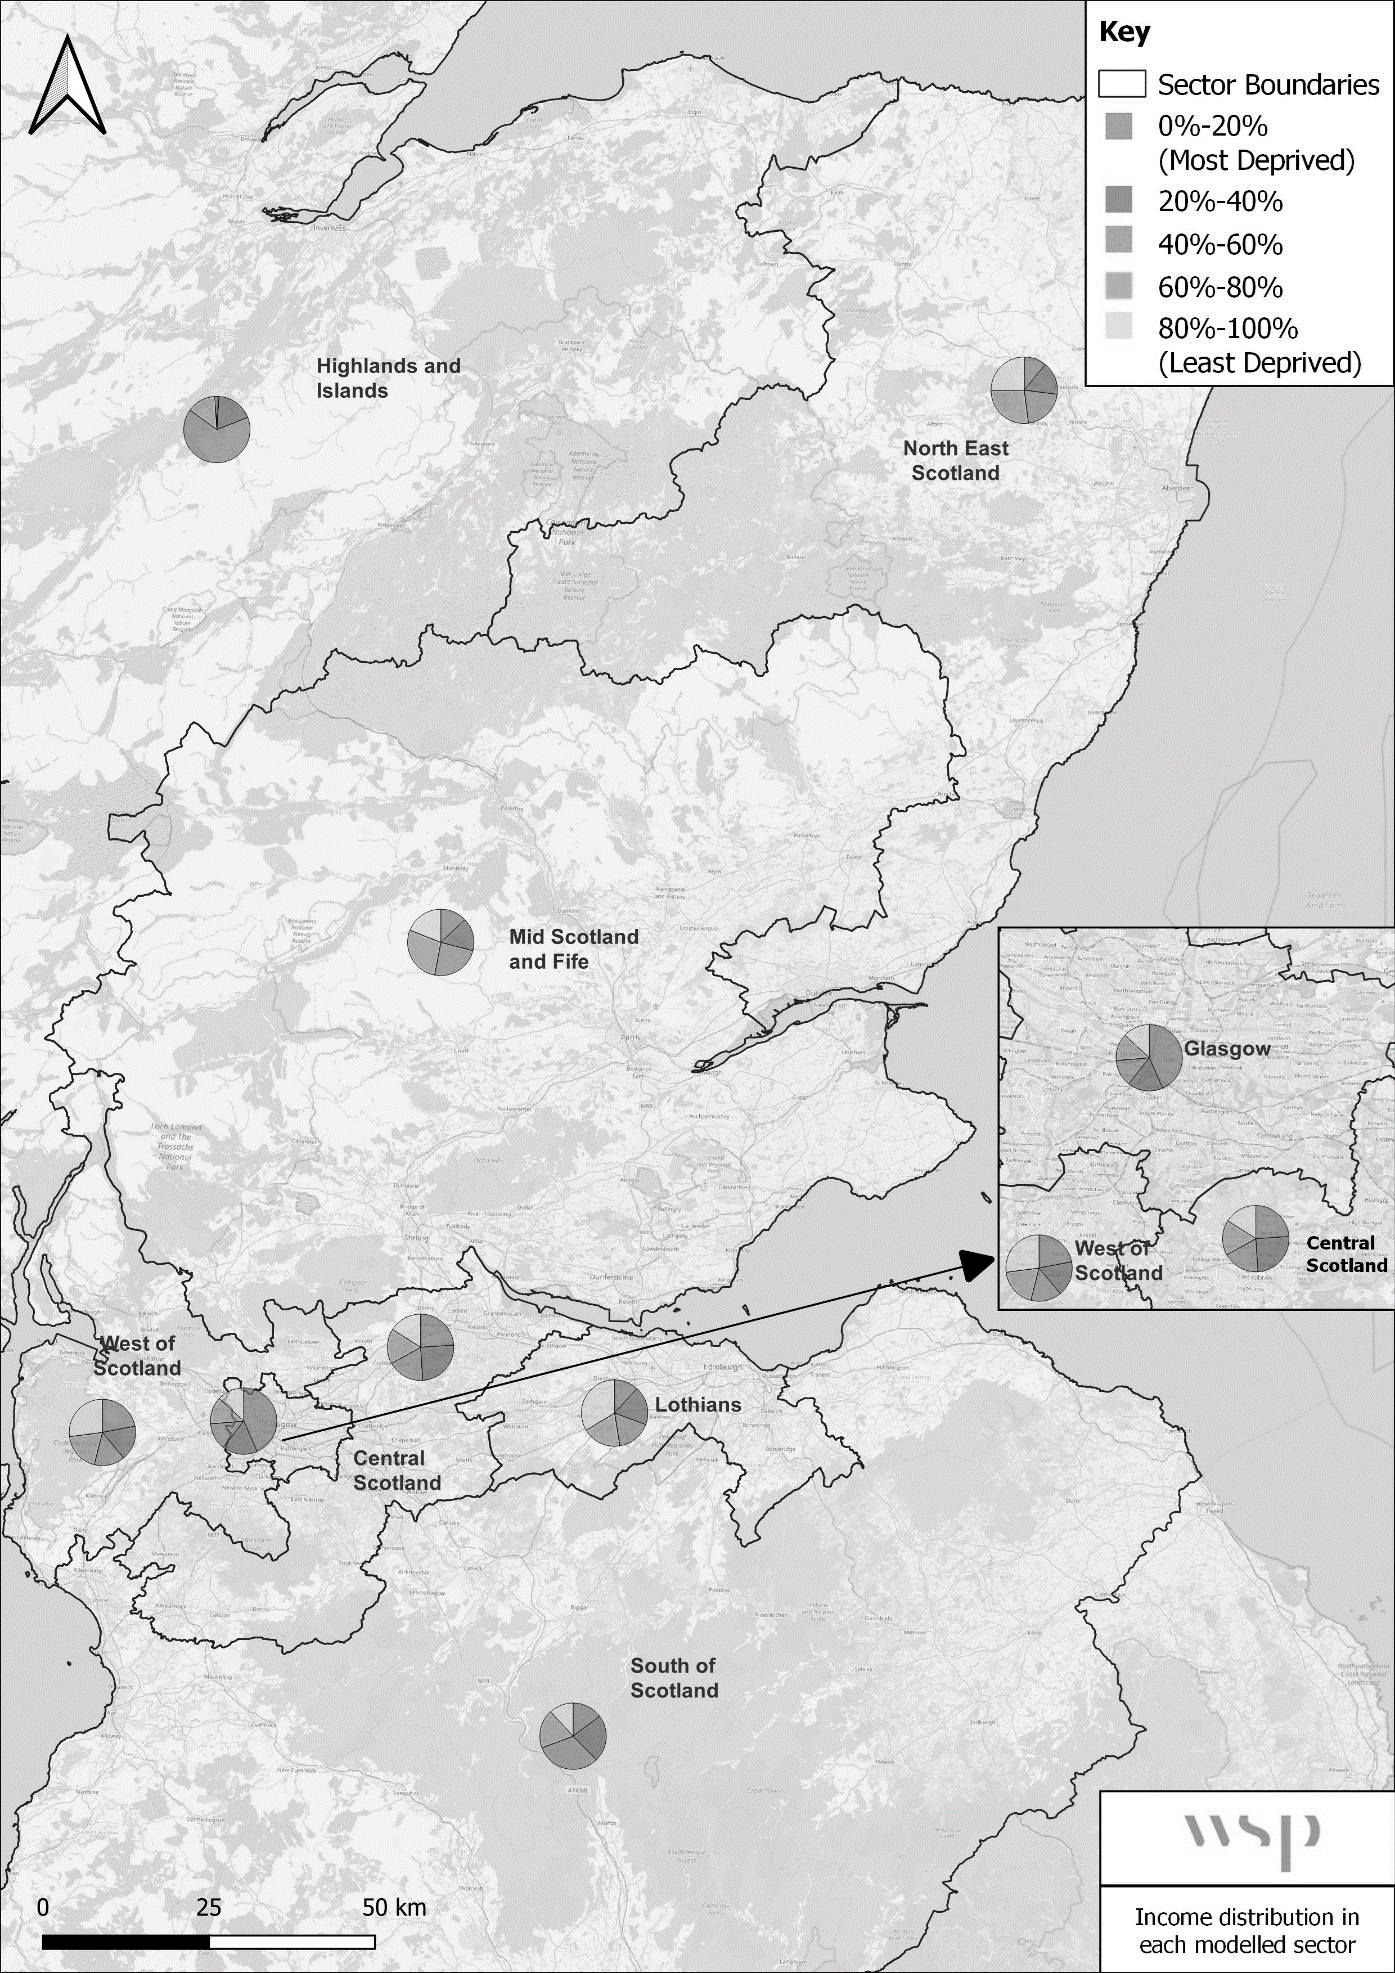
It is noted that Glasgow with 43% in the 0-20% category and 17% in the 20%-40% category, followed by Central Scotland and West Scotland are characterised with high levels of the most deprived categories of population.
Table I-19 shows the distribution of disbenefits within Scotland. The DI has been assessed by calculating the percentage point difference between the distribution of the population in each income group and the distribution of the total user disbenefits each income group experienced. The TAG criteria (TAG Unit A4.2 Table 8) state that for each income group (presented in 20% segments):
- If the proportion of the disbenefits is 5% points or more, lower than the proportion of the group in the total population, then the score is Slight Adverse;
- If the proportion of the disbenefits is in line (+/-5% points) with the proportion of the group in the total population, then the score is Moderate Adverse; and
- If the proportion of the disbenefits is 5% points or greater than the proportion of the group in the total population, then the score is Large Adverse.
Table I-19 – Disbenefits disaggregated over percentages
|
Percentages |
0%-20% |
20%-40% |
40%-60% |
60%-80% |
80%-100% |
|
Share of disbenefits in Scotland |
10% |
18% |
43% |
17% |
11% |
|
Share of population in Scotland |
20% |
20% |
20% |
20% |
20% |
|
Score |
Slight Adverse |
Moderate Adverse |
Large Adverse |
Moderate Adverse |
Slight Adverse |
The distribution remains the same for all the scenarios. Therefore, when considering the overall country, the scheme will have a Slight to Moderate Adverse impact on user benefits. It is likely that journey times will increase for non-business users who travel on A-roads/motorways, both by private car and bus, to reach employment, healthcare, and other services. This will lead to a disbenefit in reduced opportunity for economic growth, reduced access to health care, and potential isolation.
Additionally, to understand localised impacts, a detailed assessment has been undertaken to assess the difference in journey time across different origin-destination pairs due to the speed limit imposed on single and dual carriageway roads. The origins and destinations were selected based on areas with a higher proportion of the most deprived population.
An analysis of the scheme modelling outputs was carried out to understand the maximum change observed in the journey times in both peak hours between the sectors modelled. The analysis shows that journey times are estimated to increase by approximately 1% in Option 1 and 4% in Option 2 for the 100% compliance future. For the realistic scenario, this difference was reported to be less than 1% in both Options 1 and 2.
Table I-20 reports the option and scenario journey time changes for key origin-destination pairs. For both the options, “With” and “Without Policy” futures reported approximately the same journey time difference. Hence, they are not separately shown in the table below and an average of the two is reported.
Table I-20 – Journey Time Difference for Key O-D Pairs
|
O-D Pairs |
Modelled Journey time |
Total Distance (miles) |
Realistic scenario - Option 1 A and B |
Realistic scenario - Option 2 A and B |
100% Compliance scenario - Option 1 A and B |
100% Compliance scenario - Option 2 A and B |
|
Inverness to Aberdeen |
02:30:00 |
104 |
+00:03:10 |
+00:04:18 |
+00:05:19 |
+00:08:02 |
|
Inverness to Ayr |
03:30:00 |
205 |
-00:00:02 |
+00:06:19 |
-00:00:10 |
+00:15:41 |
|
Inverness to Greenock |
03:20:00 |
195 |
+00:00:04 |
+00:06:04 |
-00:00:01 |
+00:15:13 |
|
Edinburgh-Glasgow |
01:10:00 |
47 |
+00:00:02 |
+00:01:19 |
+00:00:03 |
+00:03:37 |
|
Glasgow-Motherwell |
00:20:00 |
15 |
00:00:00 |
+00:00:16 |
+00:00:01 |
+00:00:44 |
|
Glasgow-Dumbarton |
00:30:00 |
22 |
-00:00:01 |
+00:00:43 |
00:00:00 |
+00:02:05 |
It is noted that for both the 100% compliance and realistic futures, Option 1 has a maximum difference of approximately 5 minutes and 3 minutes, during the peak hours. This difference is for the 2.5-hour journey from Inverness to Aberdeen. However, the total flows for this O-D pair are not substantial enough to cause a significant impact on non-business trips. For the O-D pairs (Edinburgh-Glasgow, Glasgow-Motherwell and Glasgow-Dumbarton) which report substantial traffic flows, the time differences are negligible.
For Option 2, realistic compliance future, the maximum difference is 6 minutes and 19 seconds, for Ayr-Inverness, followed by 6 minutes 4 seconds for Greenock-Inverness, which are long distance 3-hour journeys. Under the 100% compliance scenario, this difference increases to approximately 15 minutes for these long-distance O-D pairs. However, as stated above, the traffic flows on these pairs are not material to cause an impact on the DI assessment. For O-D pairs where traffic volumes are substantial, the time variation is consistently under 5 minutes across all the scenarios. Notably, key routes like Edinburgh-Glasgow, Glasgow-Motherwell, and Glasgow-Dumbarton exhibited differences of less than 5 minutes across all scenarios.
In conclusion, although the scheme is expected to cause disbenefits throughout Scotland due to journey time increases, more localised assessment shows that these increases would be unlikely to be noticeable on key journeys for non-business users. Therefore, overall distributional impact of the scheme on user benefits is scored as Neutral for Option 1A and Option 1B and Slight Adverse for Option 2A and Option 2B.
Accidents
Any intervention that changes traffic levels and speeds or changes physical separation between people and traffic can give rise to increases or decreases in accidents. The approach for the DI appraisal of accidents uses data from STATS 19 from DfT’s Road Casualties online database for the years 2021 and 2022.
Screening
There is expected to be a reduction in collisions from the proposed reduction in speed limit. Therefore, impacts are appraised based on the change in speed in new and old scenarios on the selected network to calculate the counter factual incidents. Hence, a full DI assessment is required to assess the safety aspects of the scheme.
Assessment
The collision data analysis reveals that 48% of reported accidents happen on rural carriageways, while 52% occur on urban ones. Moreover, following the Covid-19 pandemic, nearly 40% of the evaluated links showed an uptick in reported accidents.
During the years 2021 and 2022, the majority of reported accidents, comprising 59%, were categorised as 'Slight' in severity, followed by 37% classified as 'Serious', with 4% deemed 'Fatal'.
From ‘Key Reported Road Casualties Scotland 2023’ report, there were 4,217 collisions in which someone was killed or injured, out of which 56% reported were ‘Slight’, 40% being ‘Serious’ and 4% being ‘Fatal’. Furthermore, non-built-up roads with a speed limit greater than 40mph accounted for 45% of the reported casualties and accounted 65% of those killed and 46% of those who were Seriously Injured.
The 2022 accident data was analysed further to understand the implications of speed limit changes on rural and urban carriageways. This is reported in Table I-21 below. For rural roads, the highest number of accidents (61%) were reported on roads with a speed limit of 60mph and for urban roads the highest number of accidents were reported on roads with a 30mph speed limit.
Table I-21 – Reported Accidents based on Speed Limit
|
Roads |
20 mph |
30 mph |
40 mph |
50 mph |
60 mph |
70 mph |
|
Rural |
2.1% |
9.3% |
6.3% |
5.4% |
61.0% |
15.9% |
|
Urban |
14.8% |
67.7% |
8.9% |
4.4% |
1.4% |
2.8% |
To estimate the benefits of improved road safety, average casualty details from 2021-22 (Year 2023 collision data was not available at the time of assessment) from the Stats 19 database have been taken for the in-scope network for their respective road type in the categories of rural roads/freeways (motorways) and urban/residential roads. The impact of reduced speeds has been estimated using a power law based on estimates from Elvik (2013) for different road categories. This estimates the reduction in incidents using the following formula:
counter factual incidents = baseline incidents * ( (new speed) / (old speed) )α
Where 𝛼 has been selected as the exponent (best estimate) based on the road categories and type of incident/accident to calculate the counter factual incidents based on new and old speeds. The difference between baseline and counter factual incidents is the estimated change in incidents/savings in accidents for a particular incident type resulting from the change in speed limit.
Below Table I-22 summarises the reductions predicted in accidents for each of the scenarios from the Elvik accident calculations.
Table I-22 – Reduction in forecasted accident numbers
|
Components |
1A 100% |
1B 100% |
2A 100% |
2B 100% |
1A RC |
1B RC |
2A RC |
2B RC |
|
Total reduction in accident numbers |
-48 |
-45 |
-99 |
-94 |
-26 |
-25 |
-47 |
-44 |
The valuation of the safety impacts of the proposals due to lower average speeds indicated safety benefits as set out in Table I-23 for an appraisal period of 30 years.
Table I-23 – Safety Impacts (£m, 2010 Prices and Values)
|
Components |
1A 100% |
1B 100% |
2A 100% |
2B 100% |
1A RC |
1B RC |
2A RC |
2B RC |
|
Safety Impacts |
440 |
329 |
846 |
646 |
259 |
190 |
433 |
299 |
To spatially understand the impact, the forecast change in accidents on local authority areas were analysed. Based on the demographic profiling, areas which have more than 25% of the population in the most deprived category were identified. The total forecast of accidents predicted in these council areas were then assessed.
Table I-24 summarises the proportion of length of road network which experiences a >10% decrease in the accident numbers due to the change in the speed limit for both option 1 and 2. Under the realistic compliance future, no roads reported an increase or decrease in forecast accidents for both Option 1 and Option 2. In the 100% compliance future, a few roads experience a reduction in forecast accident numbers, although this reduction is minor. Importantly, none of the roads in the areas reported a >10% increase in accidents.
Table I-24 – Proportion of length of road network that reports a >10% reduction in predicted accidents
|
Area |
1A 100% |
1B 100% |
2A 100% |
2B 100% |
1A RC |
1B RC |
2A RC |
2B RC |
|
Clackmannanshire |
1.3% |
1.3% |
1.3% |
1.3% |
0.0% |
0.0% |
0.0% |
0.0% |
|
Dundee City |
0.0% |
0.0% |
0.5% |
1.0% |
0.0% |
0.0% |
0.0% |
0.0% |
|
East Ayrshire |
0.8% |
0.8% |
0.9% |
1.1% |
0.0% |
0.0% |
0.0% |
0.0% |
|
Glasgow City |
0.1% |
0.1% |
0.9% |
0.9% |
0.0% |
0.0% |
0.0% |
0.0% |
|
Inverclyde |
0.1% |
0.1% |
1.4% |
1.4% |
0.0% |
0.0% |
0.0% |
0.0% |
|
North Ayrshire |
0.5% |
0.5% |
1.5% |
1.5% |
0.0% |
0.0% |
0.0% |
0.0% |
|
North Lanarkshire |
0.3% |
0.3% |
2.5% |
3.5% |
0.0% |
0.0% |
0.0% |
0.0% |
|
West Dunbartonshire |
0.0% |
0.0% |
0.0% |
0.0% |
0.0% |
0.0% |
0.0% |
0.0% |
2022 datasets were further analysed to understand the reported accidents in major districts. Below chart depicts the proportion of the reported accidents.
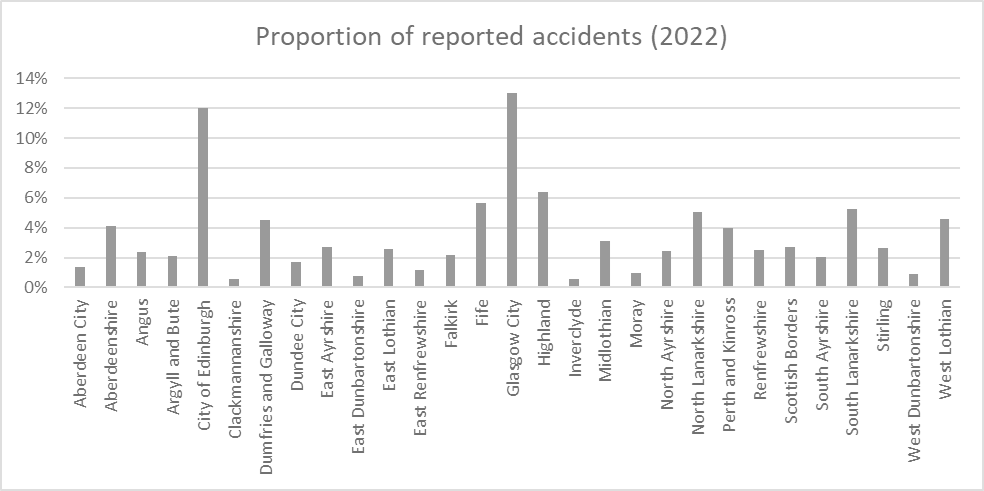
As can be seen from the above figure, the majority of accidents in the country are reported in the City of Edinburgh (12%) and Glasgow City (13%). These locations are mostly clustered around the city centre area on urban roads rather than strategic roads.
TAG Unit A4.2 identifies pedestrians, children below 16 years, older people above 70 years, cyclists, motorcyclists and young male drivers as potentially vulnerable groups who are likely to be impacted by the accidents. Children and older individuals, specially who rely on active travel such as cycle and walking are particularly susceptible to the consequences of collisions caused by high speeds. In Scotland, 2022 Census estimates that 16.4% of the population comprises children under 16 years old, while 13.2% are older individuals, both of whom stand to benefit from reduced speeds.
From ‘Key Reported Road Casualties Scotland 2023’ report, there were 5,788 reported casualties in Scotland in the year 2023. The proportion of casualties for these vulnerable groups are extracted and reported in the table below.
Table I-25 – Proportion of casualties under various vulnerable groups in the year 2023
|
Vulnerable groups |
Proportion of total casualties |
|
Pedestrian |
16.2% |
|
Pedal cycle |
7.0% |
|
Motorcyclists |
8.2% |
|
Young male drivers |
8.7% |
|
Children below 16 years |
4.5% |
As can be seen from the table above, pedestrian casualties reported account for 16% of the total reported casualties and 28% of these pedestrians are children below 16 years. Nevertheless, the scheme proposes speed restrictions on strategic key roads such as A roads and motorways, where cyclist and pedestrian activities involving vulnerable age groups are rare. As such, with the scheme in place, the benefits accrued by these user groups will be minimal. Hence, the options are appraised as Neutral.
Other vulnerable groups identified in TAG unit A4.2 include young male drivers, and motorcyclists. Slower speeds contribute to a more relaxed and comfortable atmosphere for these road users, by decreasing the likelihood of accidents. As they share the same space with the motorised traffic, the scheme's impact on these population segments may be substantial, resulting in a Slight Beneficial effect. Lowering speed limits can help mitigate risky driving behaviour among young male drivers, who are statistically more prone to speeding and reckless driving, reducing the likelihood of accidents caused by excessive speed. Furthermore, lower speeds offer greater control over their vehicles, particularly in challenging driving conditions., they can better navigate corners, intersections, and other potentially hazardous road situations, reducing the likelihood of losing control of their vehicles.
Table I-26 below summarises the DI scoring for each of the vulnerable group.
Table I-26 – DI assessment-Accidents
|
Vulnerable groups |
Options |
|
Children below 16 years |
Neutral |
|
Older people above 70 years |
Neutral |
|
Pedestrians |
Neutral |
|
Cyclists |
Neutral |
|
Motorcyclist |
Slight Beneficial |
|
Young male drivers |
Slight Beneficial |
Severance
Severance will only be problematic where either vehicle flows are significant enough to impede pedestrian movement across a road or where infrastructure presents a physical barrier to movement.
Screening
The scheme causes a change in the average speed on roads. This will impact the severance faced by the vulnerable pedestrians who access the amenities by foot. Therefore, a DI assessment should be undertaken to understand how the benefits are spatially distributed among the vulnerable groups.
Assessment
According to TAG A4.2, section 6.3.2, groups that are vulnerable to the effects of severance include no-car households, older people, children below 16 years and people with disabilities.
According to the Census 2022 Population Estimates, the population of Scotland was estimated to be 5,440,284 with 16.4% of population belonging to a category of children below 16 years and 13.2% of the population being more than 70-years-old.
From the data published by Transport Scotland, 75% of households had access to one or more cars or vans in 2022; two fifths (40%) of households had access to two or more cars or vans.
As stated in the accident section, the speed limit restrictions, as part of the scheme, focus mostly on strategic key roads such as A roads and Motorways, where pedestrian activities involving vulnerable age groups are less frequent. As such, the benefits accrued by these user groups will be minimal, thus making the assessment Neutral. For each of the social groups, the slight beneficial impact anticipated from the scheme has been detailed in Table I-27.
Personal Affordability
Criteria for the assessment of personal affordability has been assessed qualitatively. The personal affordability of transport is both a social and distributional impact as the monetary costs of travel can be a major barrier to mobility for certain groups of people, with potential impacts on their ability to access key destinations.
According to TAG A4.2, section 9.1.2, “The most significant affordability impacts will be on young and old people, and low-income households, particularly when travelling to employment or education. People with disabilities may also suffer significant disbenefits when faced with higher travel costs (due to limited transport choices) whilst unemployed adults also have difficulties in accessing services (including training) due to low incomes”.
Hence, the primary group of interest is people in deprived households along with vulnerable sections of society.
Screening
Criteria for assessment of personal affordability as outlined in TAG Unit A4.2 states that if fuel and non-fuel Vehicle Operating Costs (VOC) change as a result of the scheme then a personal affordability DI appraisal should be undertaken. As the scheme is anticipated to lead to journey speed changes, this affects the VOC of the road users. An assessment has therefore been undertaken.
Assessment
Table I-27 summarises the VOC benefits discounted to 2010 prices and for an appraisal period of 30 years produced from TUBA.
Table I-27 – VOC Benefits Summary
|
Scenario |
Description |
Benefits |
|
1a 100% |
Option 1, without policy and 100% compliance. |
£17.60m |
|
1a RC |
Option 1, without policy and realistic compliance. |
£8.60m |
|
1b 100% |
Option 1, with policy and 100% compliance. |
£164.22m |
|
1b RC |
Option 1, with policy and realistic compliance. |
£107.50m |
|
2a 100% |
Option 2, without policy and 100% compliance. |
£10.66m |
|
2a RC |
Option 2, without policy and realistic compliance. |
£6.64m |
|
2b 100% |
Option 2, with policy and 100% compliance. |
£68.17m |
|
2b RC |
Option 2, with policy and realistic compliance. |
£46.05m |
TUBA outputs are disaggregated into eight sectors which together cover the whole of Scotland and all the sectors have reported benefits for non-business users.
Slower speeds typically result in improved fuel efficiency for vehicles. When vehicles travel at lower speeds, they consume less fuel per mile, leading to savings on fuel costs for deprived users who rely on personal vehicles for transport. Furthermore, it can also lead to lower maintenance costs for vehicles as driving at lower speeds puts less strain on vehicle components such as brakes, tyres, and engine, resulting in reduced wear and tear and longer intervals between maintenance and repairs. This can translate into savings on maintenance expenses for deprived users who may have limited financial resources for vehicle upkeep. As stated earlier, 75% of households had access to one or more cars or vans in 2022 and two fifths (40%) of households had access to two or more cars or vans. Hence, the proportion of population to accrue these benefits are significant.
Table I-28 shows the distribution of benefits within Scotland.
Table I-28 – Benefits Disaggregated Over Percentages
|
Percentages |
0%-20% |
20%-40% |
40%-60% |
60%-80% |
80%-100% |
|
Share of benefits in Scotland |
10% |
18% |
43% |
17% |
11% |
|
Share of population in Scotland |
20% |
20% |
20% |
20% |
20% |
|
Score |
Slight Beneficial |
Moderate Beneficial |
Large Beneficial |
Moderate Beneficial |
Slight Beneficial |
The overall impact is assessed as Moderate Beneficial impact.
Noise and air quality
Noise impacts are likely to occur where an intervention results in changes to traffic flows or speeds or where the physical gap between people and traffic is altered. As per TAG A4.2, consideration should be given to the number and locations of schools in the area as well as other places where children are likely to spend time outdoors such as nurseries, playgrounds, parks and other open spaces. Also, consideration should be given to the number and locations where older people may spend time.
Screening
There will be change in the average speed of vehicles due to the proposed scheme. Therefore, an impact on air quality and noise is anticipated.
Assessment
The reduction in speed limit on rural carriageway roads and motorways is expected to reduce the amount of noise and vibration caused by passing traffic to residents who currently live near the affected carriageway roads. Nevertheless, a relatively large change in traffic flow or speed is required to bring about a perceivable change in noise and air quality level (assuming all other traffic variables are constant). A 10mph increase or decrease in the existing speed limit is too little to cause a notable impact to the vulnerable groups. Therefore, DI is assessed to have a Neutral impact on these environmental indicators.
Accessibility
Screening
No further assessment is required for accessibility because the proposals do not bring about changes to public transport in the form of rerouting, timings, frequency or changes to the waiting facilities.
Security
Screening
The proposals do not bring about changes to public transport security through a change in public transport waiting/interchange facilities or access to such facilities which would likely affect user perceptions of personal security (the focus on the impact analysis method described in TAG). Hence, no further assessment is required.
Summary
A summary of the Distributional Impact scoring on each of the indicators assessed is provided below.
Table I-29 – Summary of Distributional Impacts
|
DI Indicator |
Assessment |
|
User Benefits |
Neutral for Options 1A and 1B and Slight Adverse for Options 2A and 2B |
|
Accidents |
Neutral to Slight Beneficial |
|
Severance |
Neutral |
|
Personal Affordability |
Moderate Beneficial |
|
Noise |
Neutral |
|
Air Quality |
Neutral |
|
Accessibility |
Screened out |
|
Security |
Screened out |