Appendix G – Economic Appraisal Approach
General
User benefits, which include time savings, fuel-related Vehicle Operating Costs (VOC), non-fuel Vehicle Operating Costs and operator and Government revenues typically form the main part of benefits attributable to nationwide schemes. The assessment reported here uses the DfT’s Transport User Benefit Appraisal (TUBA) software (November 2023 TAG update).
Demand, path-weighted average time, distance matrix skims from the Do Minimum tests (including the traffic management scenarios) and Do Something tests for the opening and future years (design years).
TUBA generates the following economic outputs:
- Time savings;
- Vehicle Operating Costs (VOC) savings;
- Greenhouse gases; and
Analysis of the benefits are then carried out by considering:
- Year, over the 60-year appraisal period;
- By trip purpose/vehicle type/by time period;
- By region of Scotland; and
- Distance band.
The appraisal area for estimating user benefits is based on a nationwide approach. Any benefits during weekends and Bank Holidays are excluded from the assessment; which is advised in the DfT’s Transport Appraisal Guidance (TAG) in the absence of a weekend-specific model. Annualisation factors have been calculated for the schemes using standard average hour factors.
The TUBA results are summarised in following section of this report. It also defines the breakdown of hourly benefits, and all relevant Transport Economic Efficiency (TEE) table outputs.
The following section provides a summary of the TUBA economic assessment, including the key inputs and parameters used within the assessment and the outputs and results.
TUBA 1.9.17 using the v1.22 economic file (November 2023) was used to carry out an assessment of the user benefits for the proposed scheme.
The Transport Economic Efficiency (TEE) benefits arise from time and VOC savings over a 60-year appraisal period and are evaluated from the difference in costs between the Do-Minimum and various scheme forecasts.
Scheme Parameters
Table G-1 shows the main parameters that have been used in the TUBA scheme file.
| Parameter | Option |
|---|---|
| TUBA Version | 1.9.17 (v1.22 economics) |
| Opening Year | 2027 |
| Intermediate Year | 2032 |
| Design Year | 2042 |
Time period and annualisation factors
TUBA is able to provide user benefits for up to 8,760 hours within a year and it allocates each hour into time periods, that represent different flow group characteristics.
The traffic models developed for the proposed scheme, consists of three distinct time slices:
- Average AM (07:00-10:00);
- Average Inter-peak (10:00-16:00); and
- Average PM (16:00-19:00).
Non-modelled hours have therefore been included in the TUBA analysis by expanding modelled hours to the relevant period.
Modelled time slices have been expanded to represent a full year by using annualisation factors. The annualisation factors are summarised in Table G-2.
| TUBA Time Period | Annualisation Factor |
|---|---|
| AM | 759 |
| IP | 1518 |
| PM | 759 |
A duration of 60 minutes is used for each of the time slices as this is the standard defined in the TUBA guidance as the input matrices are defined as trips per hour.
Vehicle Type and Trip Purpose
In accordance with the DfT TAG guidance, TUBA benefits are required to be assessed with disaggregation to vehicle type and journey purposes. Seven user classes are defined in the TUBA standard economic file, representing 3 distinct trips purposes for car, two for light goods vehicles and two for heavy goods vehicles:
- Car – Employer Business;
- Car – Commuting;
- Car – Other;
- LGV – Personal;
- LGV – Freight;
- OGV 1; and
- OGV 2.
Each user class has different values of time (VOT), vehicle occupancy and fuel consumption. The traffic models developed for the proposed scheme consists of three user classes:
- UC1 Car;
- UC2 LGVs; and
- UC3 HGVs.
The demand factor has been used to split the LGV and HGV matrices using standard splits as this detail is not included within the model.
The user classes have Input Matrices, with each class having a vehicle type, purpose and person type defined. The values can be seen in Table G-3.
| Model User Class | TUBA User Class | TUBA Input (Vehicle/Sub mode) | TUBA Input (Trip Purpose) | TUBA Input (Demand Factor) |
|---|---|---|---|---|
| 1 | 1 | 1 (Car) | 2 (Commuting) | 1.0000 |
| 2 | 2 | 1 (Car) | 3 (Other) | 1.0000 |
| 3 | 3 | 1 (Car) | 1 (Business) | 1.0000 |
| 4 | 4 | 2 (LGV personal) | 0 (Commuting and Other) | 0.1200 |
| 4 | 5 | 3 (LGV freight) | 0 (Business) | 0.8800 |
| 5 | 6 | 4 (OGV1) | 0 (Business) | 0.5000 |
| 5 | 7 | 5 (OGV2) | 0 (Business) | 0.5000 |
Model Sectoring
A sector file has been defined for the model, which splits the zoning structure into 9 sectors based on the location, these sectors are as shown in Table G-4.
| Sector Number | Name |
|---|---|
| 1 | Highlands, Islands and Inverness |
| 2 | North-East Scotland |
| 3 | Mid Scotland and Fife |
| 4 | West of Scotland |
| 5 | Glasgow |
| C | Central Scotland |
| 7 | Lothians |
| 8 | South of Scotland |
| 9 | England |
Estimation of User Benefits
User benefits including time savings, fuel-related VOC, non-fuel VOC, and operator and Government revenues, typically form the major element of benefits attributable to highway schemes. The assessment reported here uses TUBA Version 1.9.17 with the November 2023 economics file v1.22.
The software provides the DfT standard approach to appraising changes in demand, travel time and operating costs. Demand, average time and average distance matrix ‘skims’ are input into TUBA, generating the following types of economic outputs:
- User Time Savings;
- Vehicle Operating Cost savings; and
- Indirect Taxes.
Analysis of the benefits has been carried out:
- Year, over 60-year appraisal period;
- By trip purpose/vehicle type/by time period;
- By region of Scotland; and
- Distance band.
Option 1
The total benefits from TUBA for Scotland can be seen in Table G-5, split by the type of benefit. To note, the total benefit provided for each of these options is without any contribution from Greenhouse Gases across the 60-year appraisal period.
| Scenario 1 | Without Policy 100% Compliance | Without Policy RC | With Policy 100% Compliance | With Policy RC |
|---|---|---|---|---|
| Time Saving Benefit | -£728,239 | -£370,434 | -£596,963 | -£287,531 |
| Vehicle Operating Costs | -£14,690 | -£5,776 | -£24,246 | -£8,685 |
| Indirect Tax Revenue | -£6,024 | -£3,254 | -£2,055 | -£1,496 |
| Total | -£748,953 | -£379,464 | -£623,264 | -£297,712 |
The cost and benefits are presented in 2010 prices, discounted to 2010.
The with policy scenarios show a significantly lower level of disbenefit when compared to the without scenarios. This is due to the differing growth due to policy, with the with policy scenarios impacting fewer users due to lower growth. The time saving disbenefit makes up the majority of the total disbenefit, with the full compliance scenario reporting more than double the amount of disbenefit in comparison to realistic compliance. This is to be expected, given the changes in speed are less pronounced with lower compliance.
Comparing the with and without policy scenarios, there is a large increase in disbenefits within the with policy scenario for vehicle operating costs. Vehicle operating costs increase throughout scenarios in this option which is due to users' routes taking longer to get to and from their destination as the speed reduction covers more roads which also contributes to fuel inefficiency. This is primarily seen within business trips while the commuting and ‘other’ trips show a benefit to vehicle operating costs.
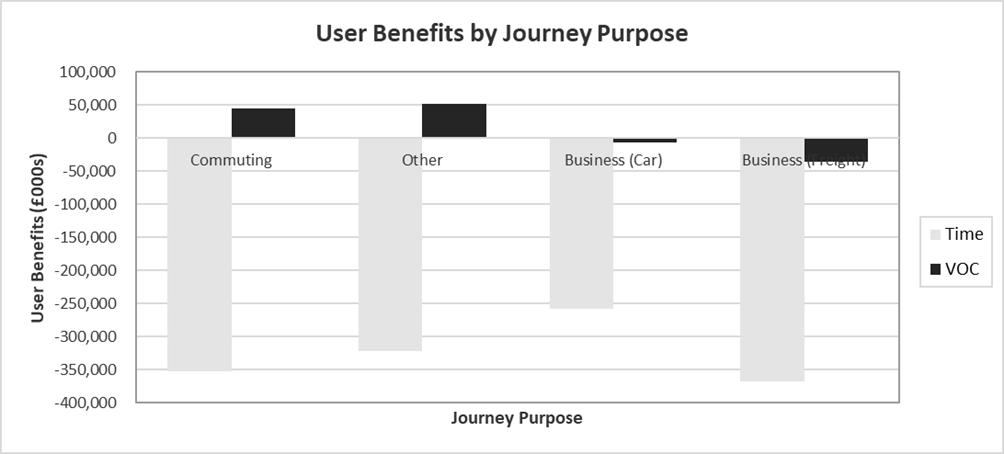
Journey Purpose
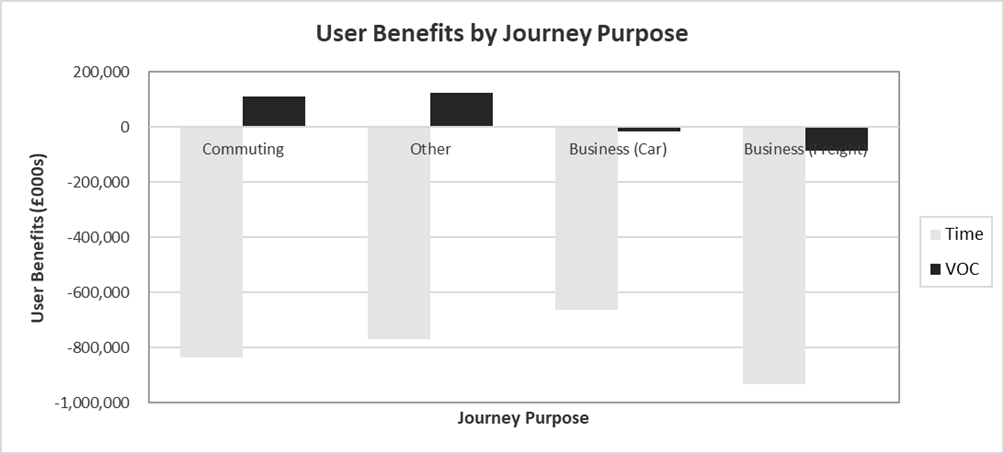
The disaggregation of the benefits by journey purpose is presented within Figure G-1 and Figure G-2 below.
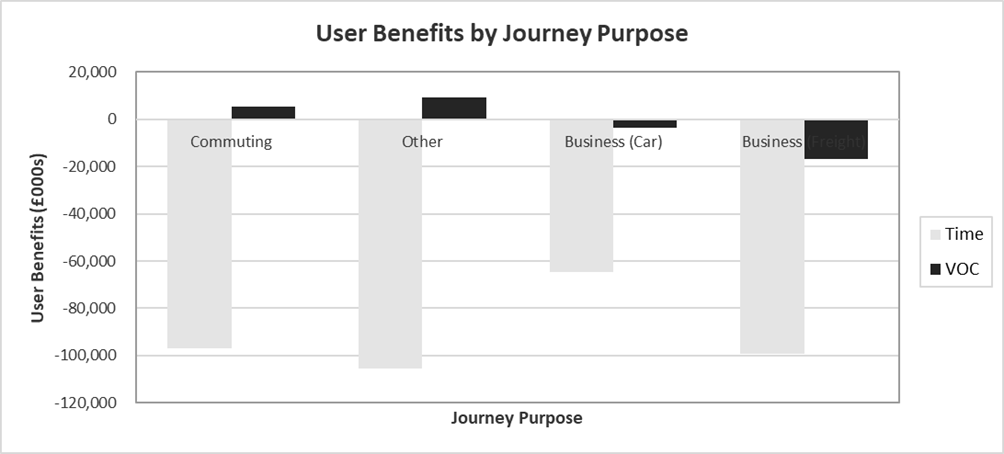
The benefits are presented in 2010 prices, discounted to 2010, NB: business user benefits are split into car and freight in the above graph. To note, other relates to leisure trips.
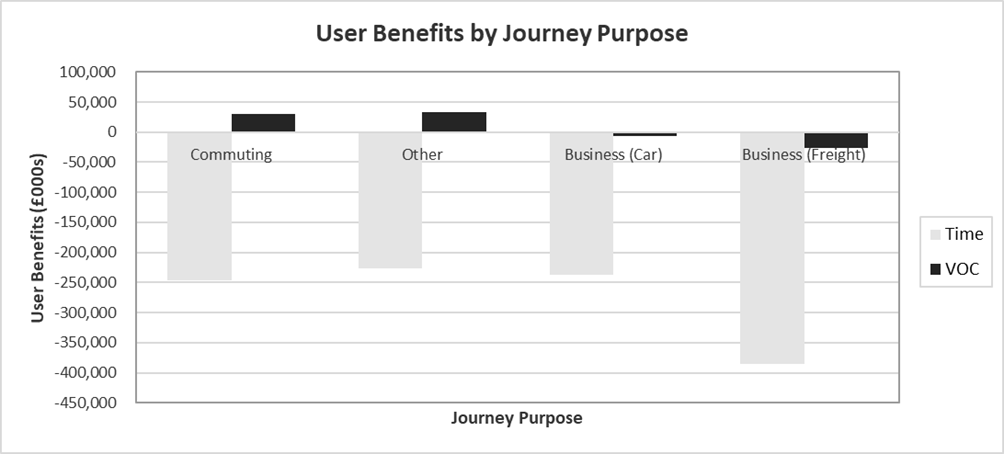
The benefits are presented in 2010 prices, discounted to 2010, NB: business user benefits are split into car and freight in the above graph. To note, other relates to leisure trips.
In the with policy scenarios, both realistic compliance and full compliance scenarios demonstrate that the travel time and vehicle operating costs (VOC) vary depending on the journey’s purpose, noting significant disbenefits in travel time, along with some benefits sought in VOC, but with disbenefits for business trips (freight and car). Travel time reflects disbenefits for all purposes but vary in degree of severity.
Disbenefits in business-related journeys, particularly concerning travel time, are most pronounced under full compliance, and remain a disbenefit under realistic compliance. This can be attributed to increased costs due to longer travel times, potentially more regulatory breaks required for longer journeys and less efficiencies in freight operations and negative impacts on time-critical freight movements, such as in the salmon industry.
Disbenefits with business related journeys (car and freight) shows the biggest negative impact in VOC. For cars, this could be attributed to more frequent maintenance due to the journeys taking longer. In relation to freight, this could be impacted as the speed is changed only for single-carriage roads and therefore may reap negligible benefits.
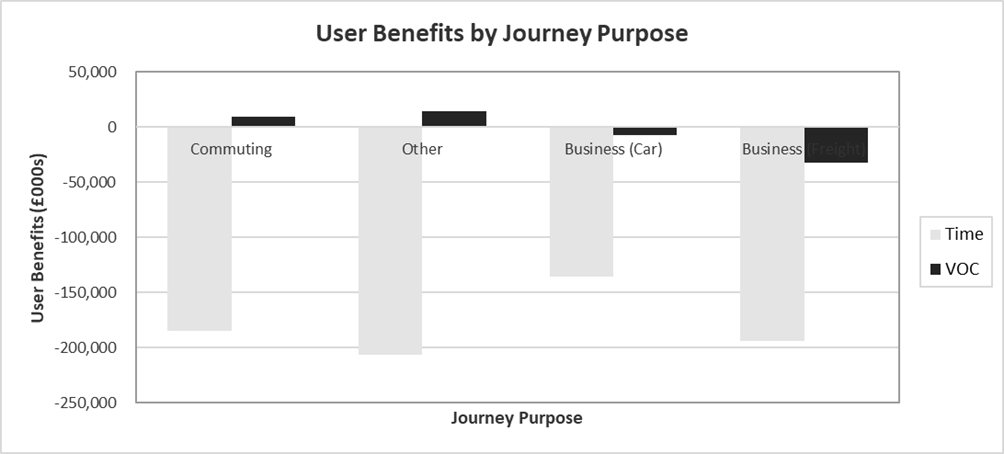
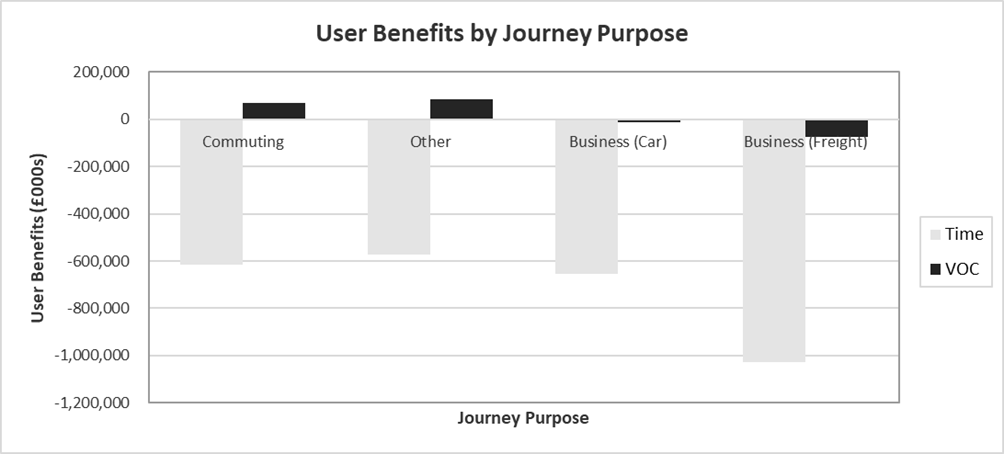
The benefits are presented in 2010 prices, discounted to 2010, NB: business user benefits are split into car and freight in the above graph.
The benefits are presented in 2010 prices, discounted to 2010, NB: business user benefits are split into car and freight in the above graph.
The with policy scenarios, shows a similar trend between realistic compliance and with full compliance scenarios with the most significant benefits being to business users due to the higher level of monetisation for these user classes.
In summary, without policy scenarios, when fully compliant, shows the most severe disbenefits across all journey purposes concerning time, particularly evident in business and freight journeys relating to VOC. It shows modest benefits VOC for commuting and other trips, albeit these are overshadowed by the substantial disbenefits related to travel time.
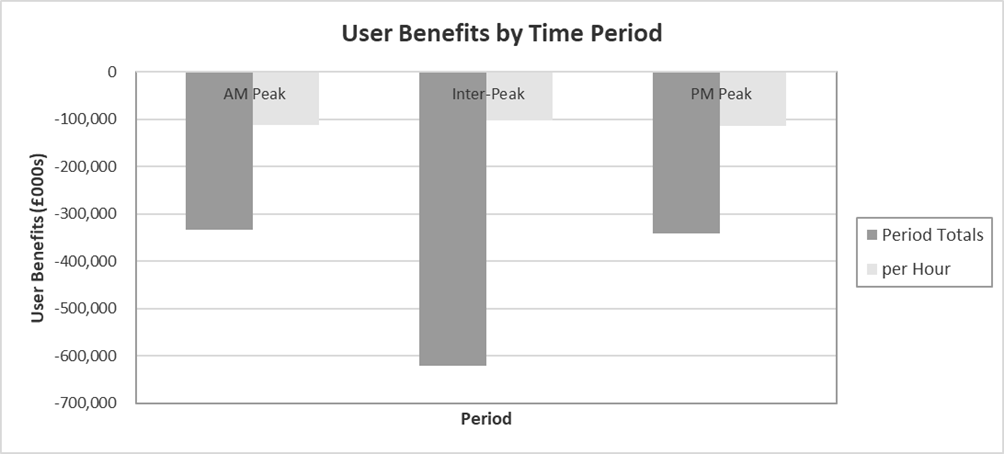
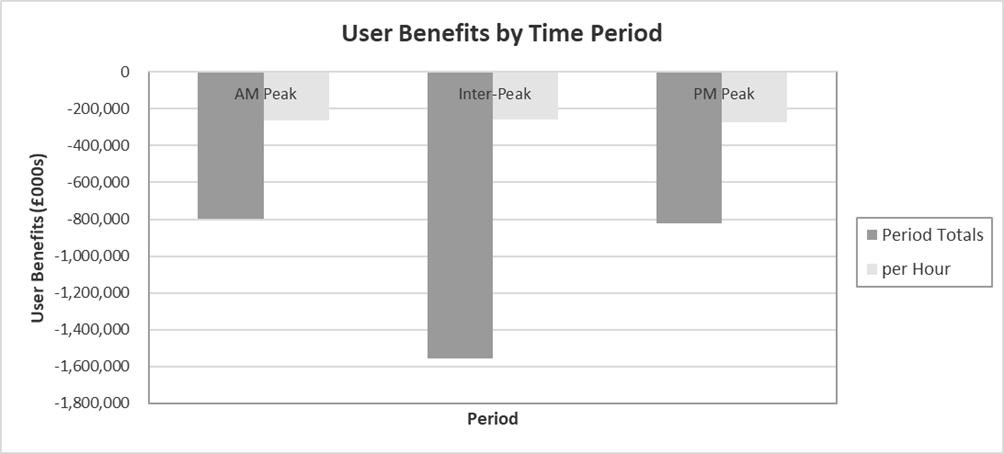
Time Period
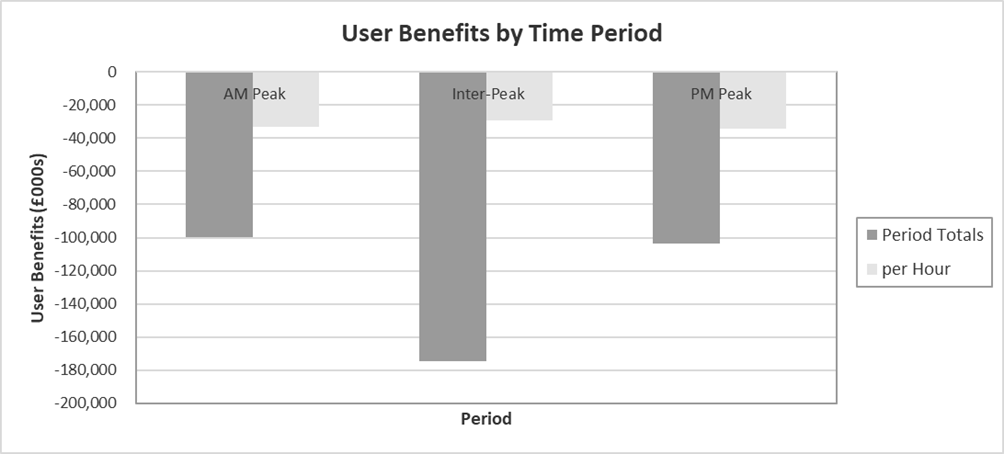
The benefits are presented in 2010 prices, discounted to 2010.
The most significant disbenefit per hour is evident in the PM peak, with approximately a 17% difference noted from the least affected amongst the three averages.
The Interpeak total underscores the most notable disbenefit within the time periods, however this is due to the longer duration of 6 hours compared to the three-hour spans of the AM and PM peaks.
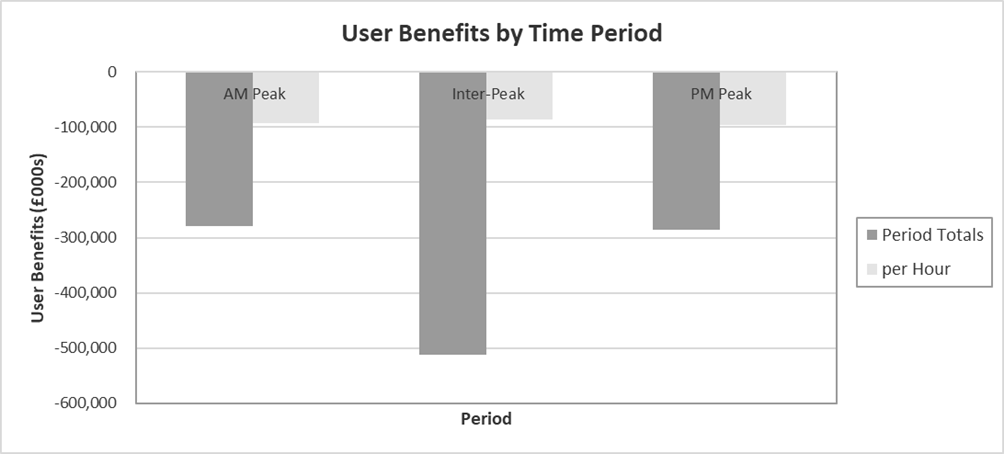
The benefits are presented in 2010 prices, discounted to 2010.
The most significant per hour disbenefit is evident in PM peak as with the without policy realistic compliance scenario, there is approximately a 16% difference noted from the least affected amongst the three per hour results.
As above, the Interpeak total holds the most notable disbenefit within the time periods, however this is due to the longer duration of 6 hours compared to the three-hour spans of the AM and PM peaks.
As expected, full compliancy exacerbates the disbenefits in both period totals and in the per hour.
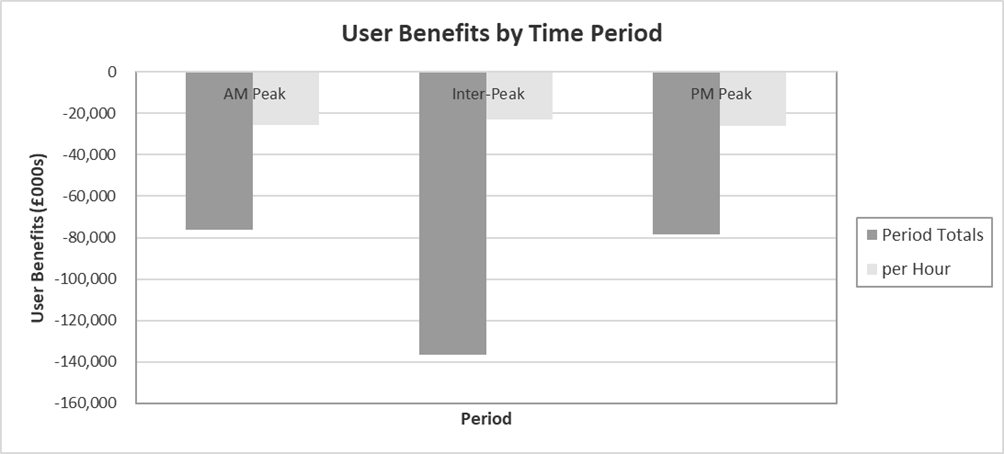
The benefits are presented in 2010 prices, discounted to 2010.
The most significant per hour disbenefit is evident in PM peak, with approximately an 14% difference noted from the Interpeak, which has the lowest disbenefit per hour.

The benefits are presented in 2010 prices, discounted to 2010.
The most significant disbenefit per hour is evident in the PM peak, with approximately an 8% difference noted from the least affected amongst the three averages.
To summarise, the PM peak was consistently the greatest disbenefit per hour across all options, while Interpeak was consistently the highest disbenefit in period totals, but this was due to it being annualised over a 6-hour period, opposed to AM and PM peak accounting for 3-hour periods.
However, the differences between per hours are relatively minor and due to differences in traffic flows as would be expected from this scheme.
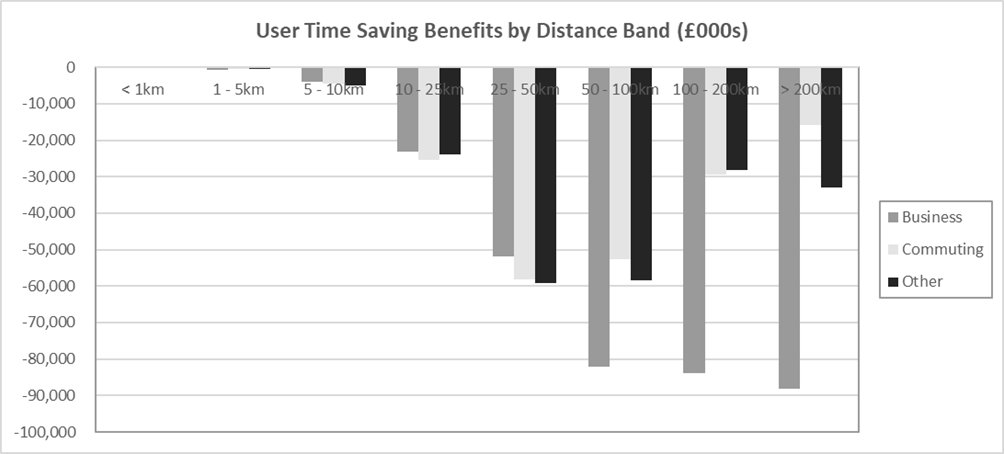
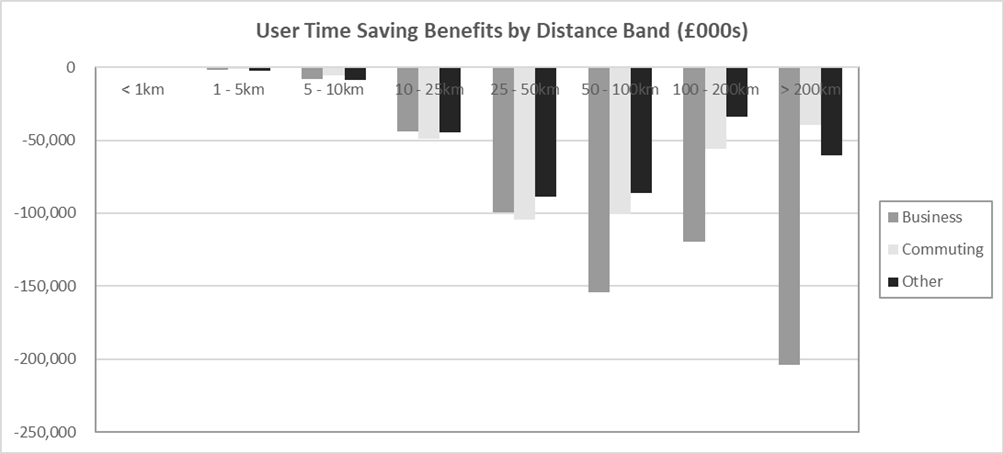
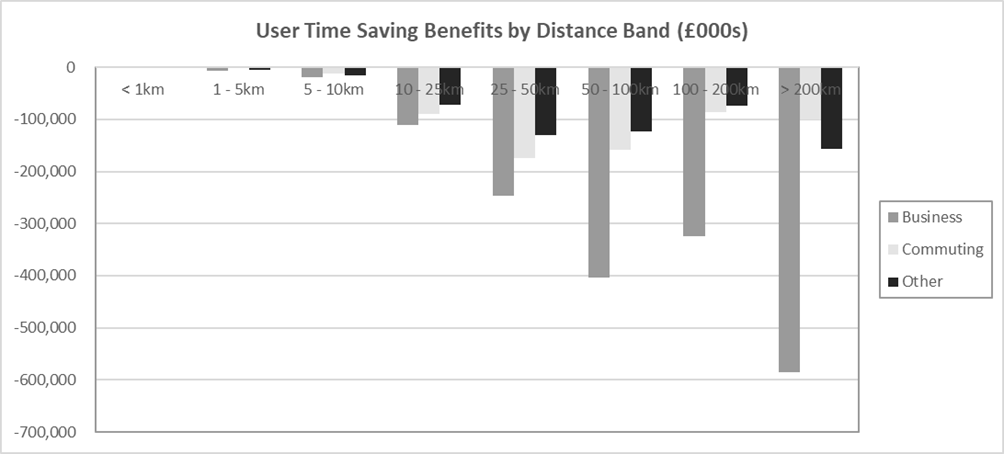
Distance Band
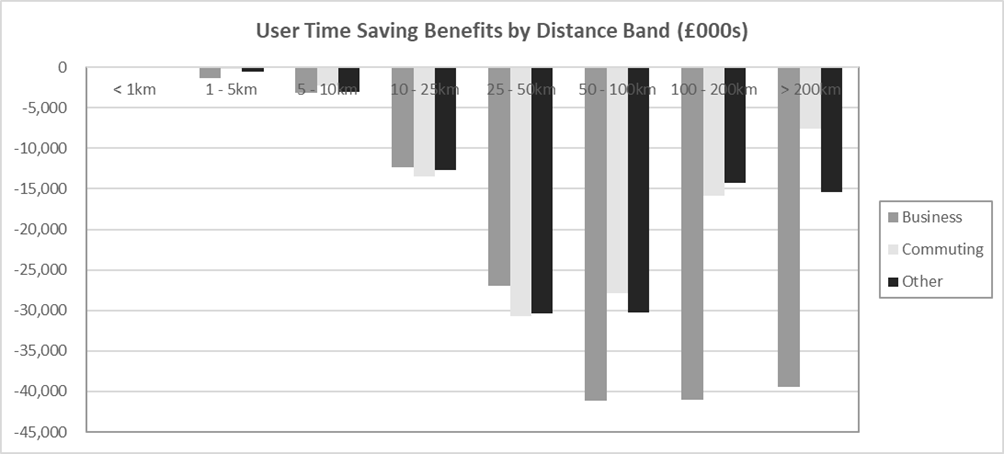
The benefits are presented in 2010 prices, discounted to 2010.
The most significant disbenefit can be seen within the 50-100km for business users, the monetary value of business disbenefits are similar in the higher distance bands of 100-200km and >200km. This is due to the increased disbenefit experienced by each user offsetting the decreased number of trips in this range.
Commuting and ‘Other’ trips both peak within the 25-50km range which is expected as this is the distance band which contains the most trips due to the geography of Scotland.
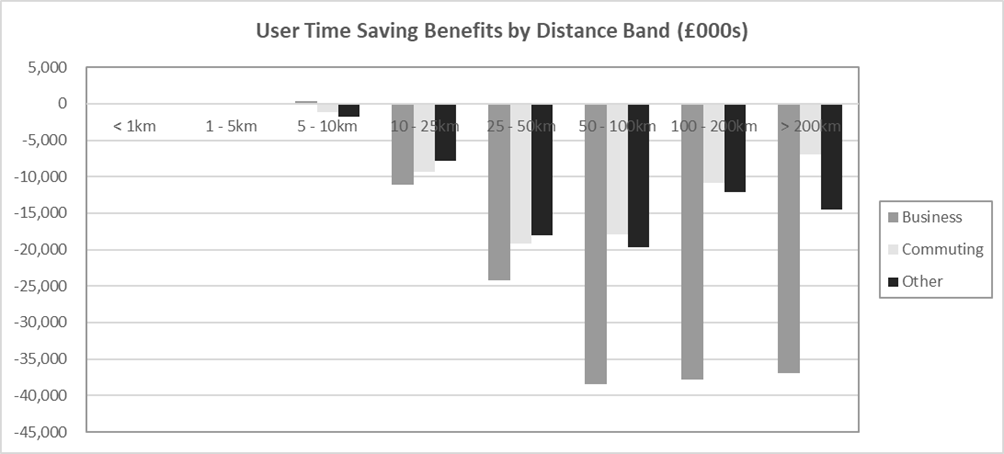
The benefits are presented in 2010 prices, discounted to 2010.
The most significant disbenefit can be seen within the >200km for business users with the changes in compliance impacting trips more the greater the distance travelled.
As with the realistic compliance scenario both Commuting and ‘Other’ show the largest disbenefit within the 25-50km trips range.
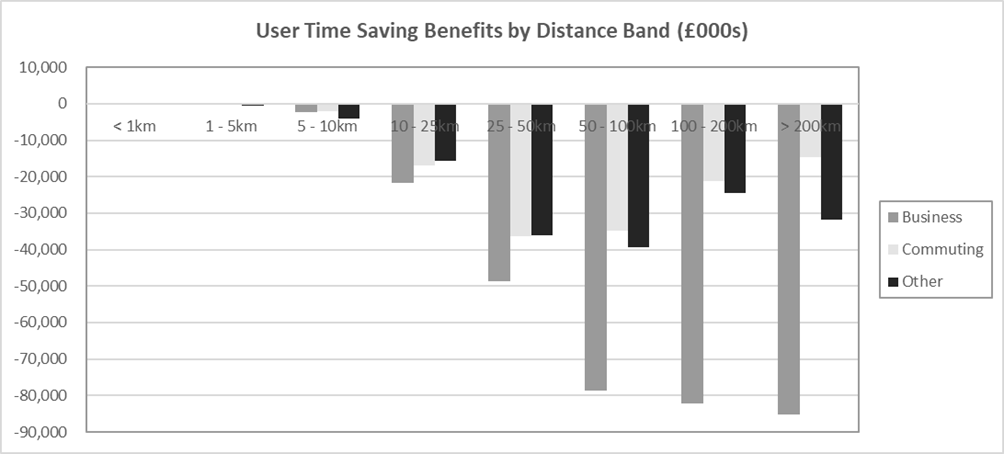
The benefits are presented in 2010 prices, discounted to 2010.
As with the with policy realistic compliance the most significant disbenefit is for business users on trips between 50-100km. Without policy shows a higher disbenefit in the 50-100km range for ‘Other’ trips when compared to with policy.
There is a large jump in disbenefit between the 10-25km range and the 25-50km range due to the trips within the 10-25km range primarily making use of local roads which are not impacted by the proposed scheme.
The benefits are presented in 2010 prices, discounted to 2010.
The most significant disbenefit can be seen within the >200km for business trips with the severity of Business disbenefits increasing in each subsequent distance band.
There is a negligible benefit to Business users within the 1-5km trip range likely due to change in delay on the network as a result of the scheme.
Overall, long range Business trips are the primary disbenefits within the assessment due to the higher values of time used in monetisation alongside the increased impacts for long range journeys. The with policy scenarios show a slight benefit for Business trips in the 1-5km range however, apart from these all-distance bands show a disbenefit.
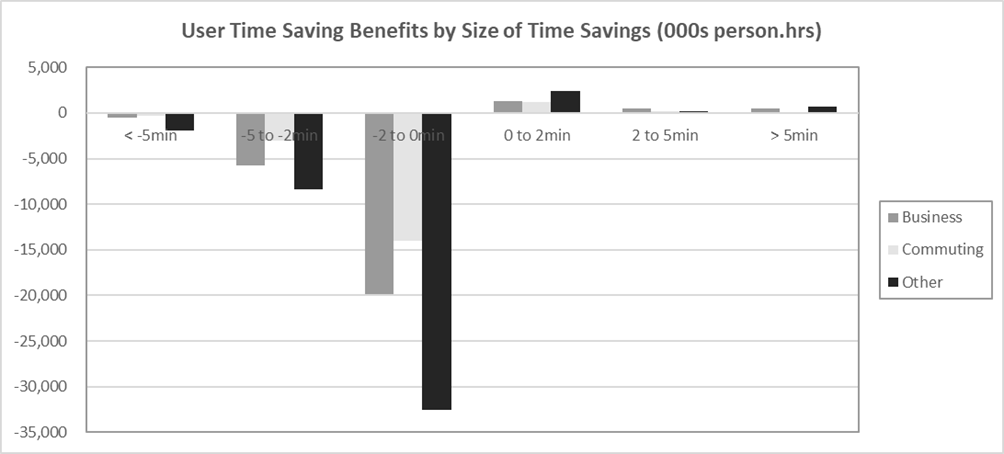
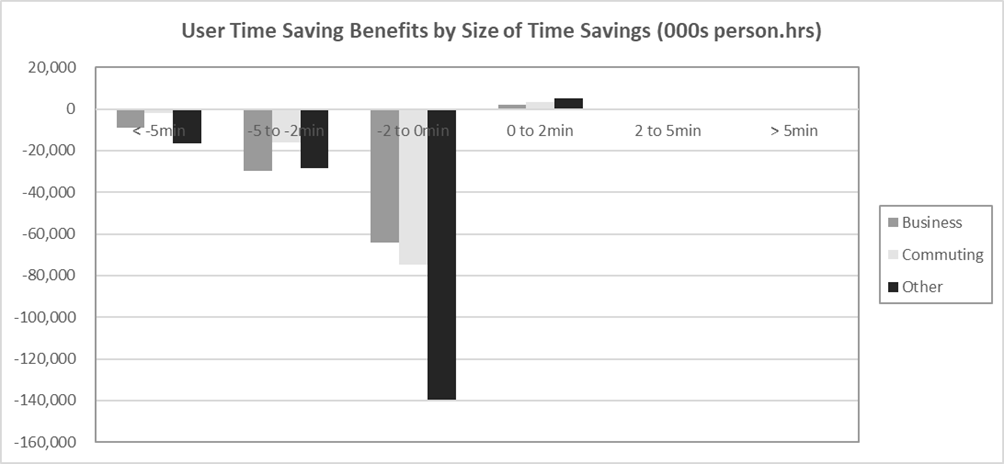
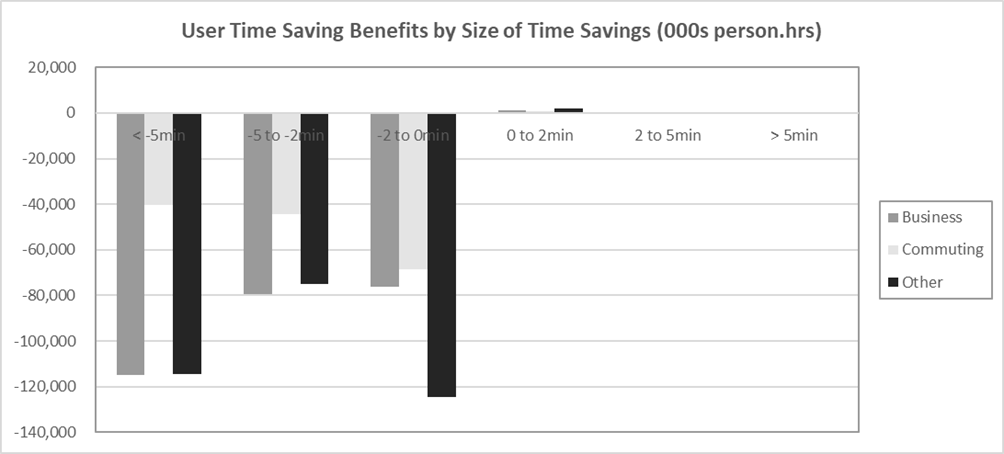
Journey Time Band
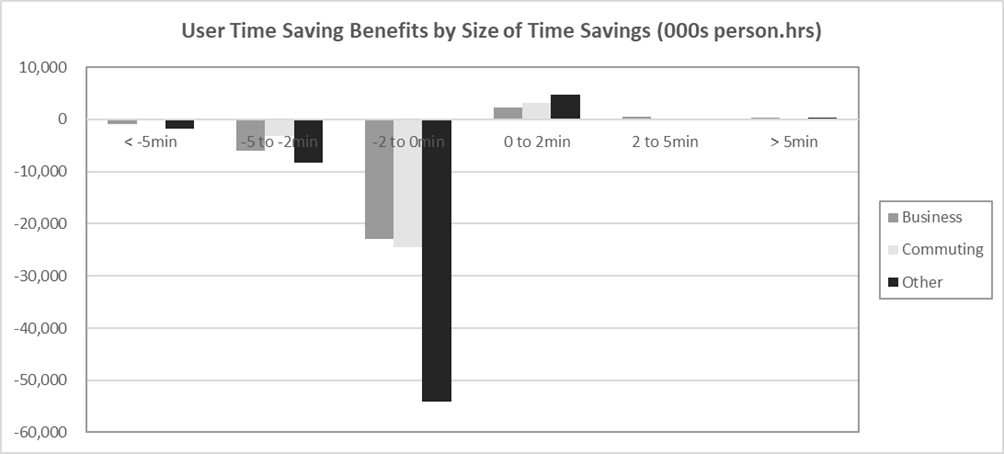
The above plot shows the time saving in person hours for without policy realistic compliance scenario. It can be seen the primary change is for trips to take between zero and two minutes longer than without the speed reduction. There is some disbenefit within journey time increases of between two and five minutes however, this is substantially lower than for the smaller time band due to the limited number of trips within this category.
The disbenefits outlined above are slightly offset by a small number of users experiencing savings of up to two minutes due to the rerouting of traffic on the network reducing delays.
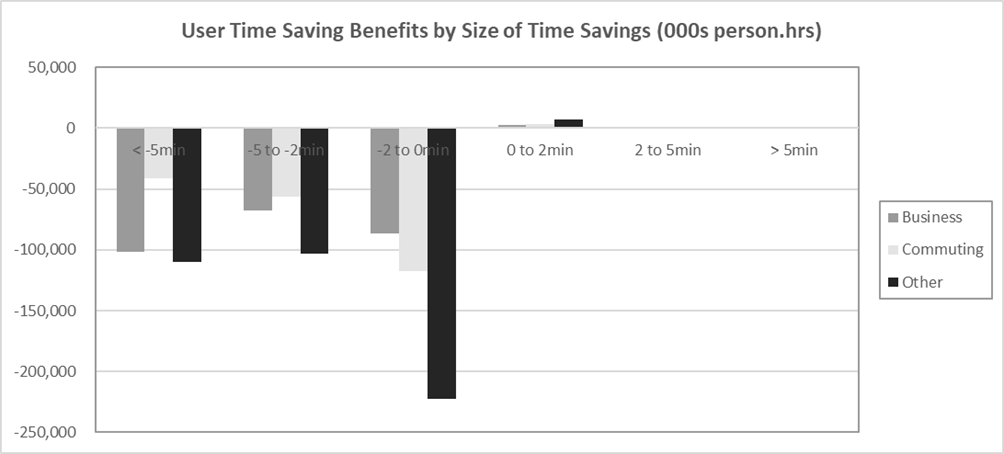
The 100% compliance scenario for without policy is shown in the below figure.
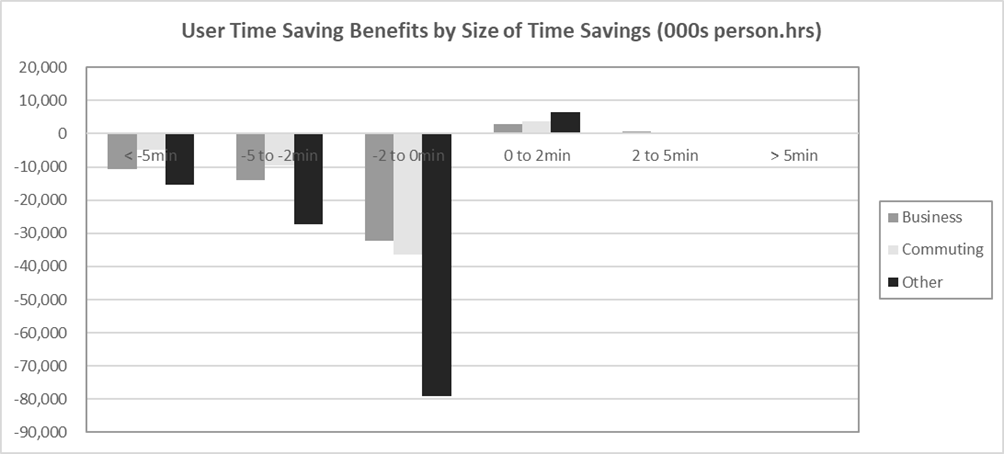
As with the realistic compliance the main impact is journey time increases of up to two minutes, especially for other users. There is a large increase in the number of person hours impacted in the two to five minutes category as well as the greater than five-minute increase in journey times category.
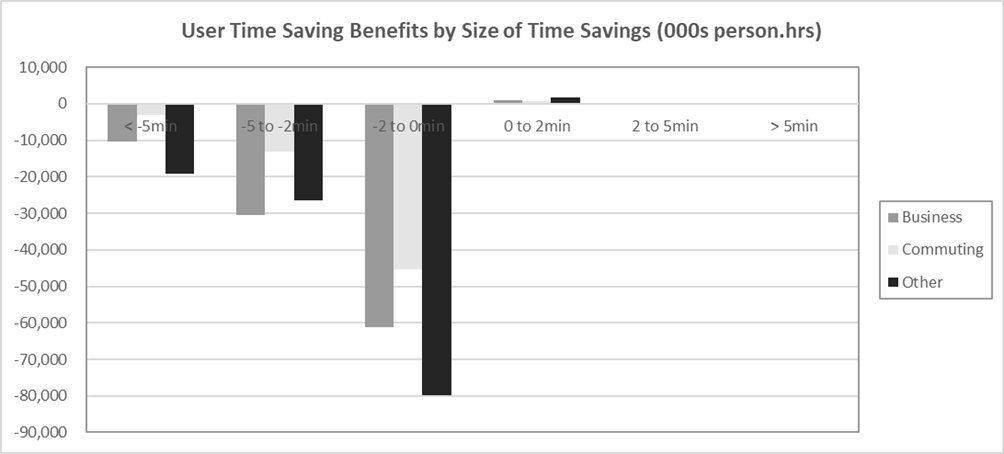
With policy realistic compliance is shown below.
The with policy realistic compliance scenario shows a similar pattern to without policy with the other users showing the largest number of additional person hours, primarily in from increase of up to two minutes. However, as expected the magnitude of change is lower than within without policy due to the lower level of traffic.
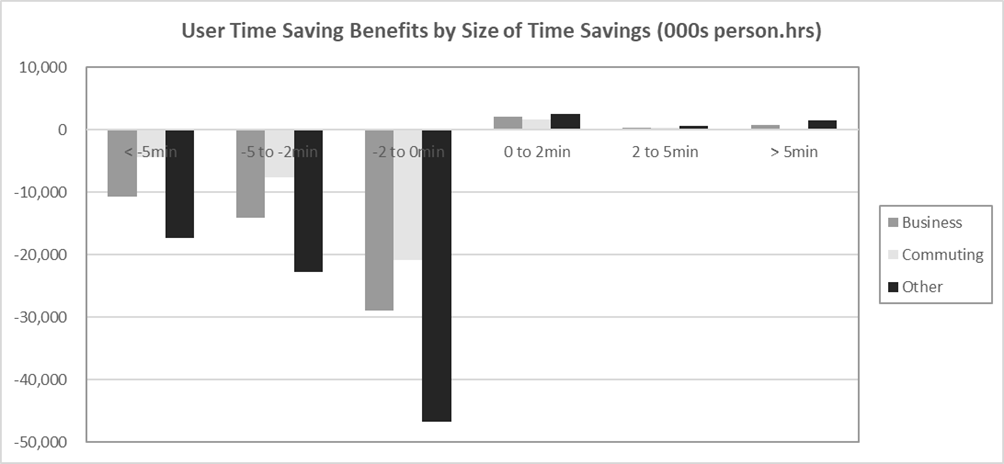
With policy full compliance shows a similar pattern to that of the full compliance without policy scenario. When comparing to the realistic compliance scenario it generally shows a decrease in magnitude. However, there is an increase in the number of extra person hours for increases of greater than five minutes.
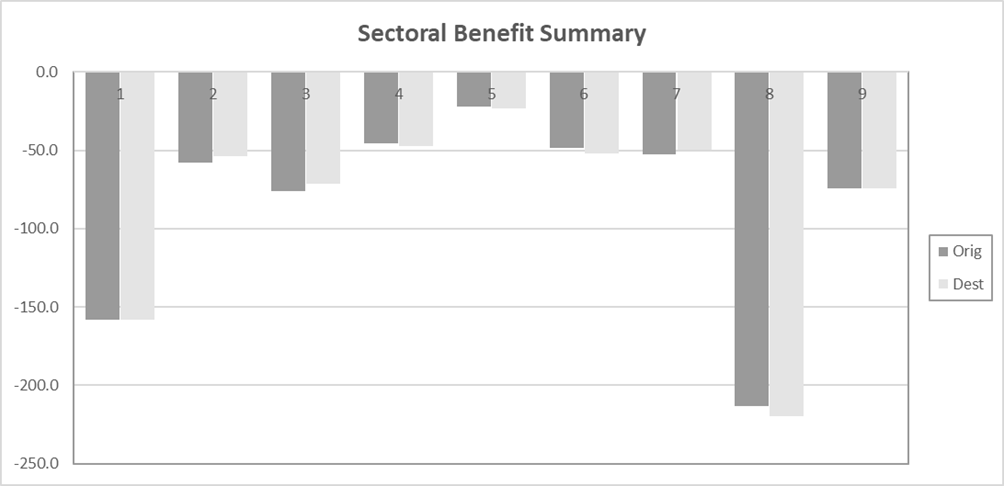
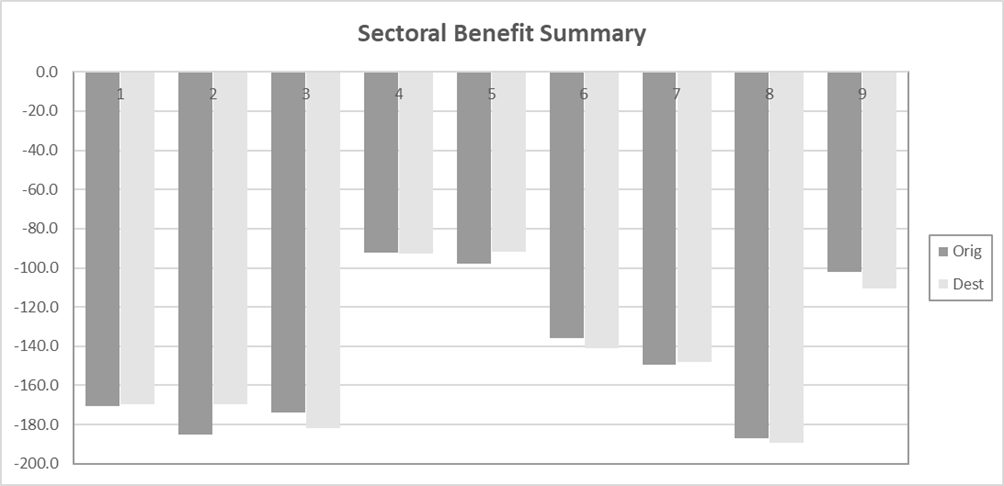
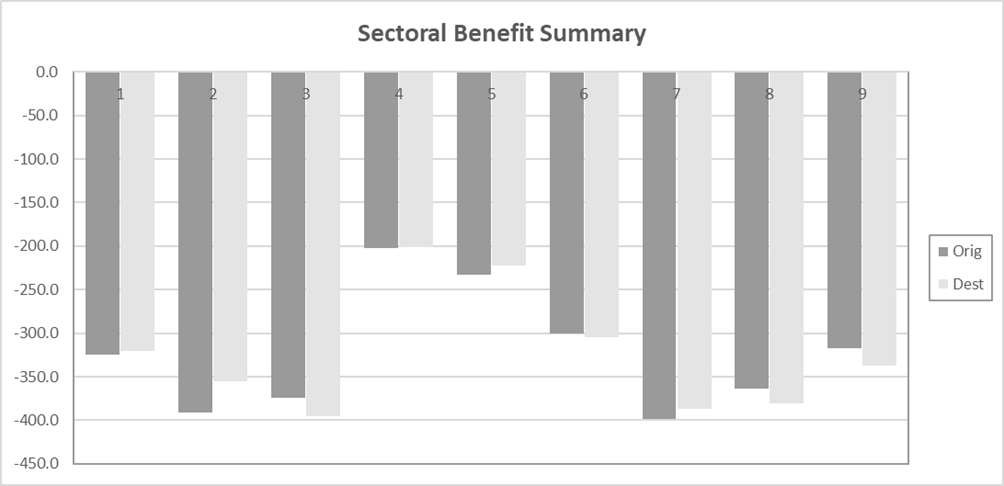
Sectoring
Analysis has been undertaken at a sector level to understand the impact of the scheme by region, these results are presented below.
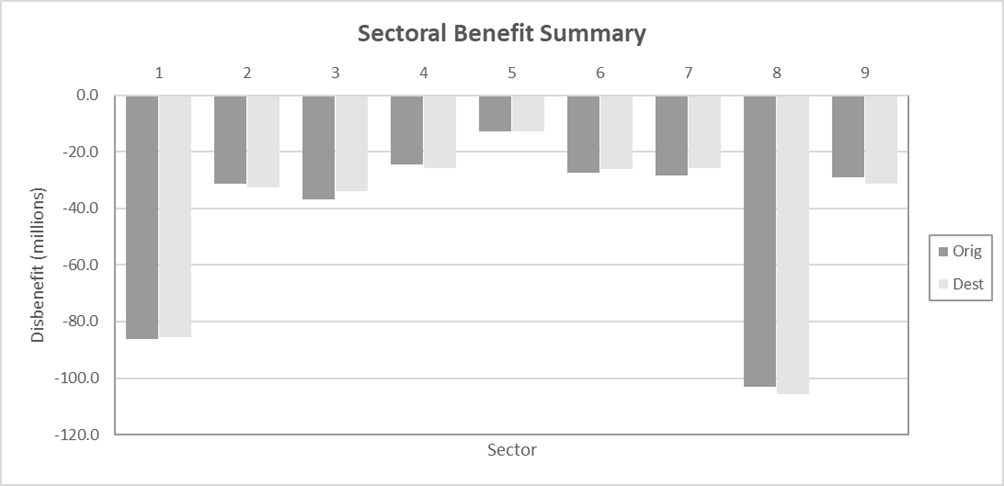
Overall, the disbenefits are primarily concentrated within two sectors: Highlands, Islands and Inverness and South of Scotland. The two sectors show disbenefit which is mainly generate by internal sector trips (e.g. from within the Highlands to the Highlands) which is primarily driven by the car users, including car business users.
The remaining sectors show a small amount of variation being around £20m of disbenefit, the exception to this being Mid Scotland and Fife which shows a higher disbenefit resulting from a high internal disbenefit. Another exception is Glasgow as this region is comprised of shorter trips which aren’t as impacted by the scheme.
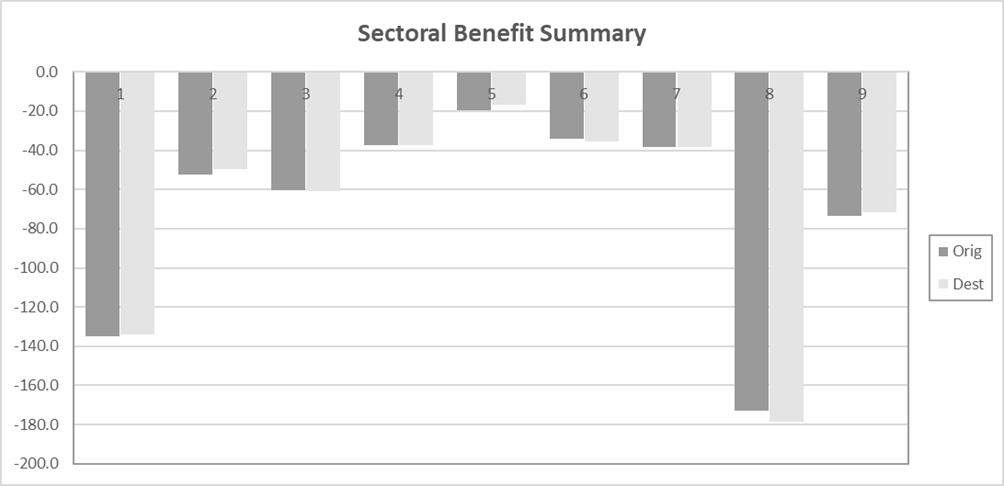
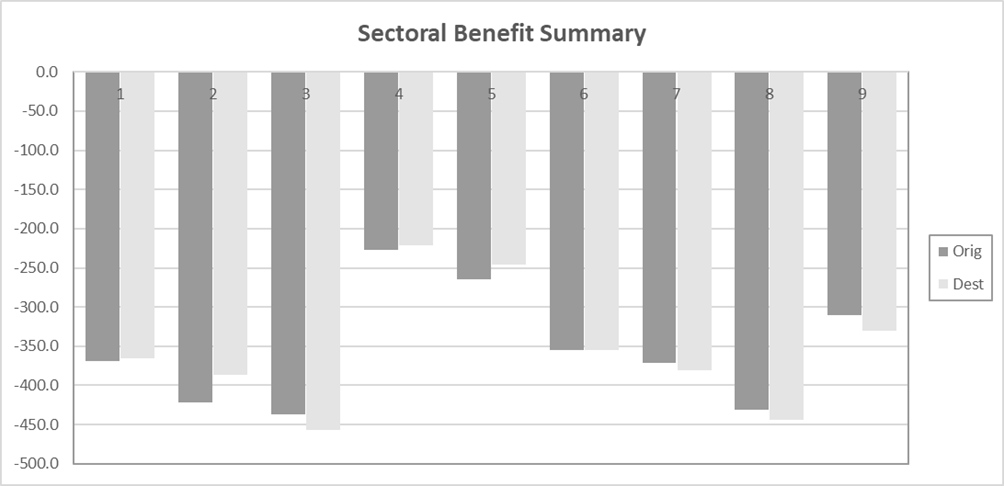
The 100% compliance scenario without policy shows the same pattern as the realistic compliance with the magnitude of disbenefit increased for each sector. The changes in compliance primarily impact the South of Scotland sector with the disbenefit doubling in this sector.
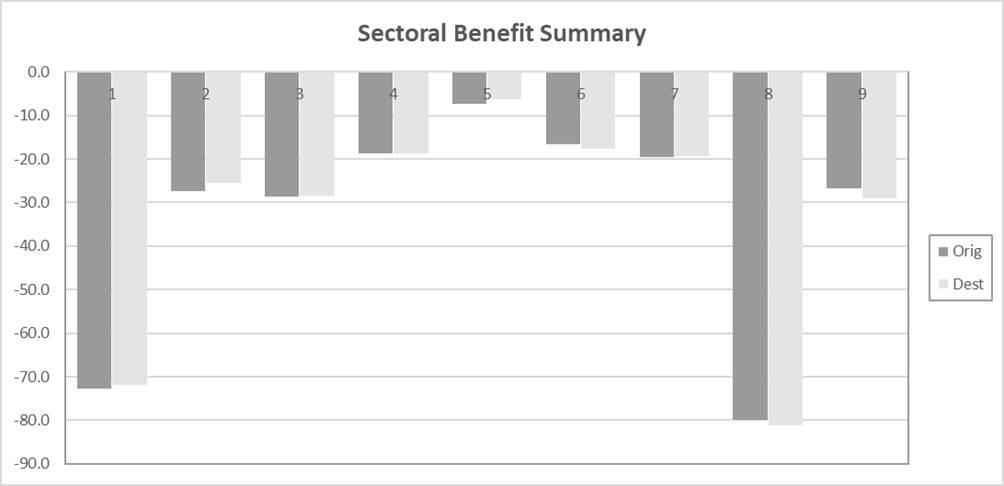
With policy shows a similar pattern when compared to without policy with the same two sectors being comprising of the majority of delay. However, the difference between these has reduced as a result of the policy in place in future years.
When compared to the with policy realistic compliance scenario there is a significant increase in disbenefit for trips starting or ending outside of Scotland. However, the primary sectors contributing to the disbenefit are consistent between all scenarios and options.
Option 2
| Scenario 2 | Without Policy 100% Compliance | Without Policy RC | With Policy 100% Compliance | With Policy RC |
|---|---|---|---|---|
| Time Saving Benefit | -£3,231,332 | -£1,312,375 | -£2,899,505 | -£1,107,130 |
| Vehicle Operating Costs | £135,218 | £54,301 | £63,881 | £32,257 |
| Indirect Tax Revenue | -£91,103 | -£36,861 | -£69,904 | -£29,535 |
| Total | -£3,187,217 | -£1,294,935 | -£2,905,528 | -£1,104,408 |
The cost and benefits are presented in 2010 prices, discounted to 2010.
Without policy results in the most significant disbenefits overall, with the full compliance scenario being significantly higher when compared to all other options presented. This outcome is expected, as it reflects an option without policy intervention, and results in the most drastic speed reduction.
All scenarios highlight significant benefits in vehicle operating costs across all options. This is due to the benefits for cars’ due to changes onto slower but shorter routes outweighing the negative impact for HGVs.
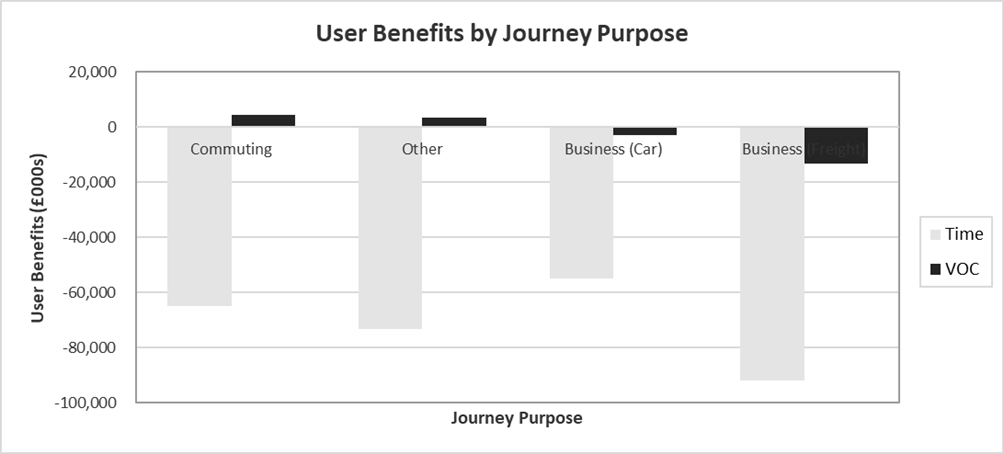
Journey Purpose
The benefits are presented in 2010 prices, discounted to 2010, NB: business user benefits are split into car and freight in the above graph
Without policy shows a similar trend between realistic compliance and full compliance scenarios, demonstrating that travel time and vehicle operating costs (VOC) vary nearly identically depending on the journey’s purpose. There are significant disbenefits in travel time, along with some benefits for VOCs, however there are VOC disbenefits for business trips (freight and car). Travel time reflects disbenefits for all purposes but vary in degree of severity.
In the Option 2 without policy scenarios, there is a significant increase in disbenefits for travel time against when compared against Option 1 without policy scenarios, for both realistic and full compliance. The increase in disbenefits relating to travel time for commuting and other non-business-related journeys can be attributed to increased journey times with Option 2 including speed reduction on national highways roads including motorways, which in turn impacts more users.
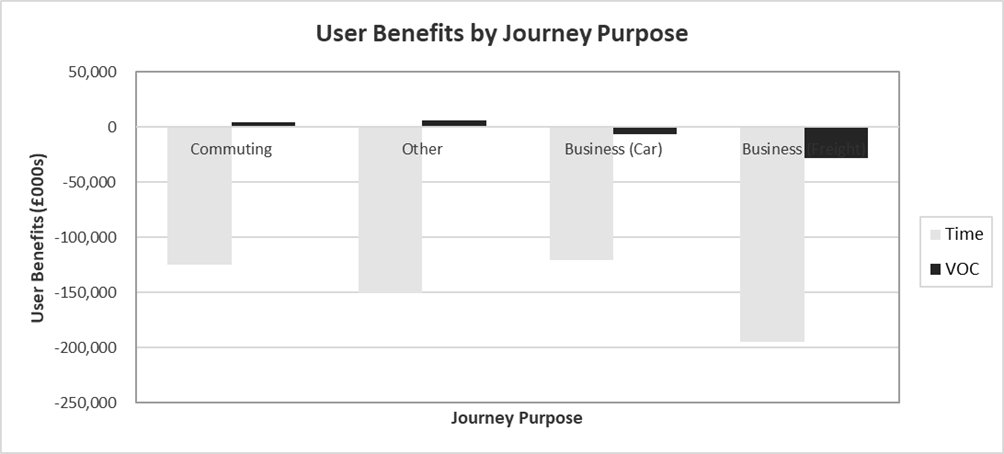
The benefits are presented in 2010 prices, discounted to 2010, NB: business user benefits are split into car and freight in the above graph.
The benefits are presented in 2010 prices, discounted to 2010, NB: business user benefits are split into car and freight in the above graph.
In the with policy scenario, both realistic compliance and with full compliance scenarios demonstrate that travel time and vehicle operating costs (VOC) vary depending on the journey’s purpose. The majority of disbenefits are in travel time, along with some minor benefits in VOCs.
Business users suffer the most travel time disbenefit in the with policy full compliancy scenario because of higher values of time and propensity towards longer trips which are more disadvantaged as a result of this scheme. This is mainly driven by business freight trips, with car business trips showing the least disbenefit.
The with policy scenario shows there is a significant increase in disbenefits for travel time against without policy (both in 100% compliancy and realistic compliancy). Disbenefits relating to travel time for commuting and other non-business-related journeys can be attributed to increased journey times with Option 2 including speed reduction on national highways including motorways which in-turn impacts more users.
VOC benefits for commuting and other non-business trips are higher than in the Option 1 scenarios due to more cars rerouting onto shorter more local routes. With policy shows more benefits in VOC in comparison to without policy and full compliancy of this scenario highlights more benefits.
Overall, there is significantly more user disbenefits in the Option 2 scenarios than in the Option 1 scenarios, which is to be expected as more roads and therefore users are experiencing a reduction in speed with the exception of HGVs. Option 2 without policy with full compliancy showcases the greatest disbenefits to all other scenarios, and Option 1 with policy with realistic compliance showing the least disbenefits.
Time Period
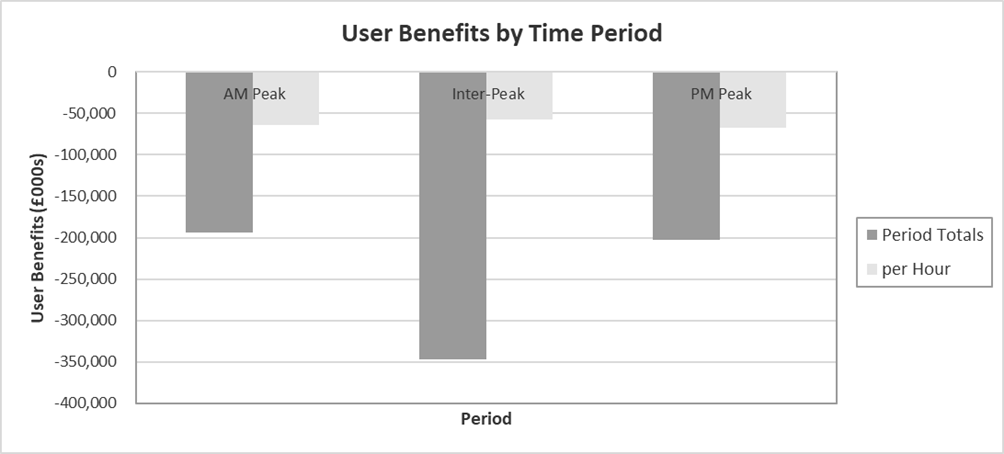
The benefits are presented in 2010 prices, discounted to 2010.
The per hour results are consistent across the three modelled time periods with the PM peak being only 9% higher than the lowest per hour result.
As in Option 1, the Interpeak time periods has the highest disbenefit, due to the longer duration of 6 hours compared to the three-hour spans of the AM and PM peak.
The benefits are presented in 2010 prices, discounted to 2010.
As with the realistic compliance the 100% compliance shows minimal variation in the impact at an hourly level with the PM peak being marginally more impacted.
The benefits are presented in 2010 prices, discounted to 2010.
As in the without policy scenario the PM peak is the largest disbenefit per hour, however this is more pronounced than within the with policy without a 12% variation from the Interpeak.

The benefits are presented in 2010 prices, discounted to 2010.
To summarise, the PM peak is consistently the greatest disbenefit per hour across both options and all scenarios. Similarly, the Interpeak is consistently the highest disbenefit in period totals, due to it being examined over a 6-hour period, opposed to AM and PM peak accounting for 3-hour periods.
For both options, full compliancy exacerbates the disbenefits in both period totals and per hour. Without policy with 100% compliancy yielded the highest disbenefits in both period totals and per hour, while with policy with realistic compliancy showcasing the least.
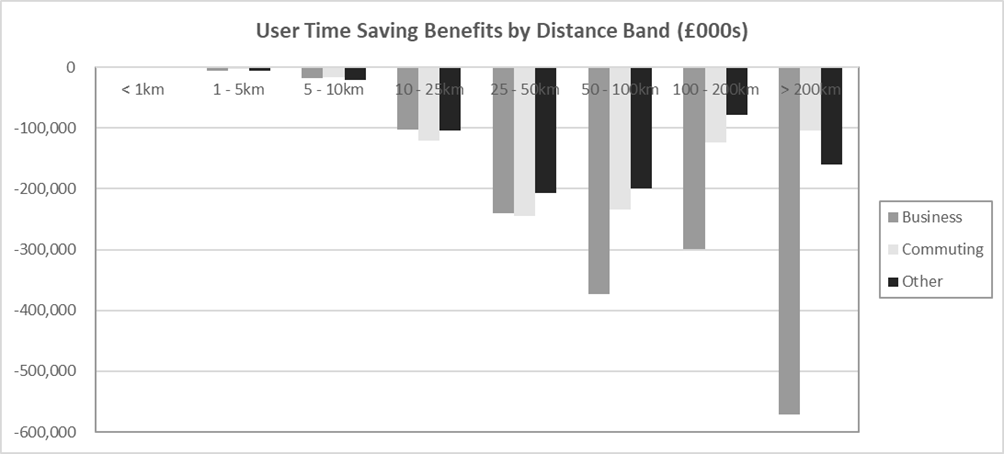
Distance Band
The benefits are presented in 2010 prices, discounted to 2010.
The most significant disbenefit can be seen within the >200km for businesses, this is significantly different to the pattern seen within Option 1. This is due to the inclusion of National Highways roads within Option 2 which cause further disbenefit especially to long range trips.
The highest disbenefits for commuting and other non-business trips can be seen within 25-50km, as this is the most common distance band for these trip purposes.
The benefits are presented in 2010 prices, discounted to 2010.
As with the realistic compliance, the most significant disbenefit can be seen within the >200km for businesses. There are no benefits to be gained in time savings by distance across any of the trip purposes in this scheme. The highest disbenefits for commuting and other non-business trips can be seen within 25-50km.

With policy shows similar results to without policy with business user trips in the 50-100km, 100-200km and above 200km ranges showing the greatest disbenefit.
The benefits are presented in 2010 prices, discounted to 2010.
The most significant disbenefit can be seen within the >200km for businesses. There are no benefits to be gained in time savings by distance across any of the trip purposes in this scheme. The highest disbenefits for commuting and other non-business trips can be seen within 25-50km.
Journey Time Band
The above plot shows the time saving in person hours for realistic compliance in the without policy scenario. It can be seen the users are mostly impacted by between zero and two minutes longer than without the speed reduction. There is some disbenefit within journey time increases of between two and five minutes, this is mainly for business users as they are making longer trips.
The disbenefits outlined above are slightly offset by a small number of users experiencing savings of up to two minutes due to the rerouting of traffic on the network reducing delays.
The 100% compliance scenario for without policy is shown in the below figure.
As with the realistic compliance the main impact is journey time increases of up to two minutes, especially for other users. There is a large increase in the number of person hours impacted in the two to five minutes category as well as the greater than five-minute increase in journey times category. The full compliance leads to a higher increase in person hours for in the over five-minute band then within the two-to-five-minute band.
With policy realistic compliance is shown below.
With policy shows a similar pattern to without policy with changes of up to two minutes being the most common. However, this category shows a larger reduction in magnitude when compared to the larger increases due to the differing policy in this scenario.
With policy full compliance shows a drastically different pattern to any of the other scenarios with the other users with changes between zero and two minutes still being the highest, However, the next highest change as are from the greater than five minute category as the Option 2 scheme impacts a greater range of road and therefore, has a larger impact on most trips especially on longer distance trips.
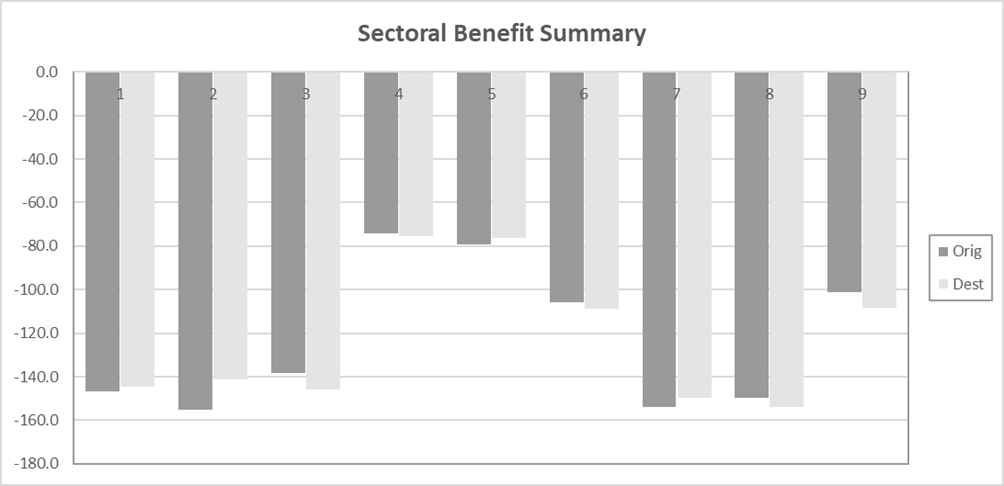
Sectoring
Analysis has been undertaken at a sector level to understand the impact of the scheme by region, these results are presented below.
Without policy shows that the disbenefits are similar between origin and destination trips in each of the sectors with the main difference being within North East Scotland.
When compared to Option 1 without policy, the disbenefit is more evenly distributed throughout Scotland, with sectors 1 and 8 no longer showing the majority of disbenefit. These two sectors have showed minimal change when compared to Option 1 due to a large proportion of roads in these areas being impacted in Option 1 and therefore having no change in Option 2.
Without policy 100% compliance shows a large increase in disbenefit within sector 3, Mid Scotland and Fife, with this now being the primary source of disbenefit.
With policy realistic compliance shows a near identical pattern to without policy realistic compliance, with the same two sectors, 4 and 5 showing the least disbenefit by a large margin. This is due to the number of trips within sector 4, West of Scotland and the nature of the trips in sector 5, Glasgow.
With policy 100% compliance shows a similar pattern to the realistic compliance however, the magnitude of benefits is significantly higher in all sectors.
Summary
This report covers the economic appraisal approach to user benefits and outturn results from the proposed reduction in speed limits across Scotland. This has been done suing industry standard software TUBA using the outputs from the TMfS for each option and scenario.
The results are presented in Table G-7 below.
| Option | Scenario | 100% Compliance | Realistic Compliance |
|---|---|---|---|
| Option 1 | Without Policy | -£739,598 | -£374,576 |
| Option 1 | With Policy | -£620,831 | -£295,951 |
| Option 2 | Without Policy | -£3,052,000 | -£1,239,907 |
| Option 2 | With Policy | -£2,806,960 | -£1,061,916 |
Analysis of these results have been undertaken to understand the impacts by journey purpose, time period, distance band and region of Scotland.
It is expected business users, both cars and HGVs, will be primarily impacted across all scenarios, this is due to the long range of these trips. This disbenefit is significant for these purposes resulting from this alongside high values of time.
The impact per hour is expected to be relatively consistent across the modelled time periods with the PM peak showing a slightly higher disbenefit than the AM and Interpeak. However, the Interpeak has the highest disbenefit overall due to the higher number of hours in the period.
The majority of disbenefits are for business users for trips above 50kms in distance, while this is a small subsection of trips there is a large impact due to the length and use of the strategic road network for these trips.
Across all scenarios the majority of users are expected to be impacted by less than two minutes when compared to existing journey times as reflected within the journey time banding.
The impacted regions differ between Option 1 and Option 2, with the former showing a high concentration of disbenefit in two regions, Highlands and South of Scotland. In contrast, Option 2 show a relatively even disbenefit across Scotland with Glasgow showing less delay than other regions.
Option 1 is expected to be a minor to moderate disbenefit overall, depending on the growth and compliance.
The option varies in disbenefit with the realistic compliance showing around 40% of the benefit of the full compliance scenario. This is in line with the assumptions made around realistic compliance showing a 4 km/h decrease for every 10 km/h change in speed limit.
The difference in growth due to policy shows a smaller change in disbenefit with around a 15% total decrease, due to the maximum decrease of 20% not being achieved until the design year.
Option 2 is expected to be a major disbenefit with the changes in compliance and policy create a wide range of results.
The maximum disbenefit from this option is over four time that of Option 1 at just over £3bn. In a realistic compliance scenario, the values are again 40% of the full compliance lining up with the assumptions made within the modelling.
The with policy growth scenario has a lower proportional impact on the full compliance scenario when compared to the realistic compliance scenario.