Particle image velocimetry
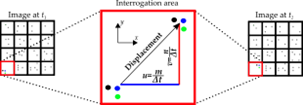
Particle Image Velocimetry (PIV) is an image comparison technique originally developed to detect and measure the movement of particles in a fluid or gas. The principles underlying the image comparison have been extended here to the detection and monitoring of slope movement in a dynamic natural environment. A high-resolution Single Lens Reflex camera was originally located on the hillside opposite the A83 road in a weatherproof cabinet by Newcastle and Northumbria Universities, and subsequently replaced with a permanent installation with secure power. The images obtained by the camera are divided into small regions called the interrogation areas (IA). The corresponding IAs from two images, for example: image A captured at the time t1 and image B captured at t2 are cross-correlated to obtain the displacement at t2 = t1 + Δt along the horizontal (x) and vertical (y) directions of the imaged tracers. Once the displacement has been determined, the x-component u and the y-component v of the velocity vector can be calculated if Δt is known. This concept is illustrated in Figure 2 for one IA.
The cross-correlation between two images is implemented as Eq. (1), full derivation is given in Appendix 2.
Eq. (1): C(m,n)=∑_i ∑_j A(i,j) B(i-m,j-n)
The purpose of this research has been:
- To develop a robust automatic change detection software for the new dual camera installation
- To develop a region of interest tool so that specific areas of the slope can be automatically reported on if necessary
- To develop a new grid-based slope system to help unify the dual camera perspectives and improve the clarity of reporting on the new system
- To use the new grid-based reporting system to detect and alert via email a key user group of any movement beyond an agreed threshold
- To train Jacobs engineers to run the software for specific areas and to use this within their regular reporting of slope movements. Comprehensive, step-by-step instructions have also been provided to Jacobs and are included as Appendix in the provided documents.
The camera was aimed primarily at the slope above the A83 road to enable the monitoring of slope movement. Photographs of the slope were taken at typically 15-minute intervals. By comparing two images (photographs) captured at different times, it is possible to detect changes in the slope, including those that indicate movement. This approach enables the identification of precursory signs of potential slope failure, allowing for timely intervention/inspection to assess the slope area identified. Additionally, ongoing monitoring through image comparison provides valuable insights into the stability of slopes, facilitating the development of effective mitigation strategies to reduce the risks associated with slope movement.
PIVlab is open-source software that was originally developed for airflow monitoring, utilizing high-speed camera sampling rates. Modifications were made to the software to optimize it for landslide monitoring, including adjustments to its algorithms and data processing capabilities. These customizations were necessary to enable PIVlab to accurately and effectively analyse the movement of slope surface structure in the context of landslide monitoring. The software modifications implemented have involved:
Region of Interest
The built-in region of interest (ROI) tool was limited to selecting rectangular ROIs. Consequently, when inspecting the entire slope, both the A83 and the background sky would be included, resulting in vectors generated by clouds and cars on the A83, which were not relevant to slope change detection. To address this issue, a versatile freehand ROI tool was integrated, enabling the selection of multiple ROIs of any shape. This ensured that the software exclusively processed the slope or the specific areas of interest.
Image Duration calculation
PIV requires an accurate calculation of movement vectors based on the elapsed time between two images. The original version of the software was limited to using a predetermined elapsed time value. However, in the modified version, this limitation was addressed by enabling real-time calculation of the period between images using the metadata associated with the image files. As a result, the software now automatically calculates the time duration between the two images it is processing.
Image registration
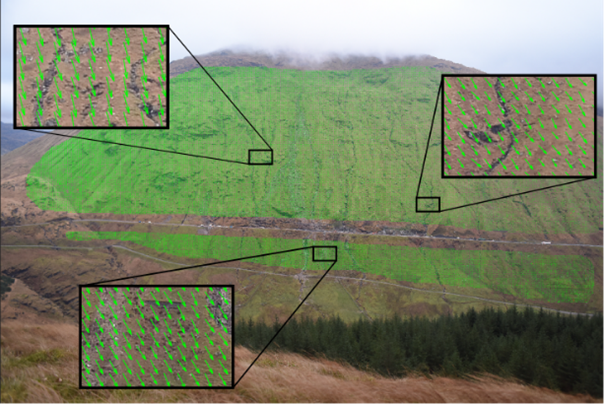
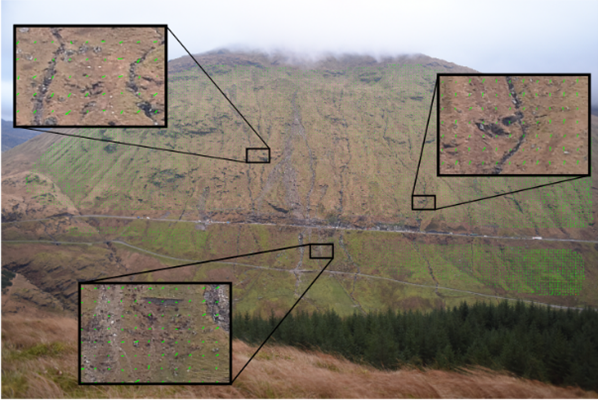
A robust image registration algorithm was developed to counteract the noise generated by camera vibrations resulting from strong winds. This algorithm ensured that the images captured during high-wind events were properly aligned, mitigating distortions and inaccuracies that could have degraded to efficacy of image comparison. The inclusion of this algorithm highlights the attention paid to ensuring that the software was optimized for accurate and reliable performance in challenging environmental conditions. Figure 1(a), show the noisy vectors generated by camera movement due to wind vibration. These vectors are not observed after image registration as shown in Figure 1(b).
Figure 1. Phase alignment of two images 15 minutes apart
Ref: Khan MW, Dunning S, Bainbridge R, Martin J, Diaz-Moreno A, Torun H, Jin N, Woodward J, Lim M. Low-Cost Automatic Slope Monitoring Using Vector Tracking Analyses on Live-Streamed Time-Lapse Imagery. Remote Sensing 2021; 13(5):893.
Denoising Filters
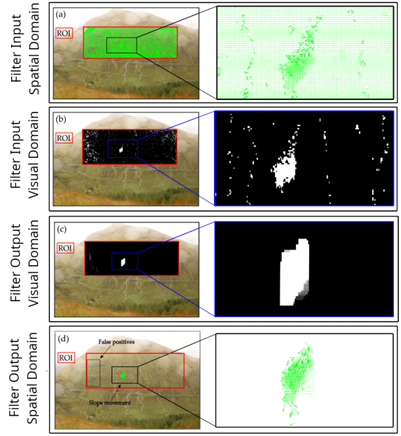
A filtering mechanism was integrated into the software's output processing to address and eliminate spurious readings caused by factors such as vegetation movement and inadequate/variable lighting conditions on the slope. The purpose of this feature was to enhance the accuracy and reliability of the output generated by the software. By effectively removing this noise, the software became more efficient in its ability to detect and monitor slope movement, thereby improving its overall effectiveness in providing reliable results. The filtering is done by converting the vectors into visual domain, this is followed by applying an erosion filter on the visual representation of the vectors. Erosion filters serve as specialized tools in morphological image processing, designed to selectively eliminate pixels along the periphery of objects within an image. These filters are particularly effective at mitigating visual disturbances, often manifested as diminutive, isolated patches in the visual domain. By eradicating the borders of these small, noisy patches, the filters substantially reduce visual clutter. Additionally, erosion filters are capable of attenuating the boundaries of patches caused by genuine slope movements. While the core of these larger patches may remain, their peripheries are effectively minimized. Consequently, the output generated by erosion filters primarily encapsulates authentic movements, with a significant reduction in extraneous noise.
The erosion filtering process described above reduces noise but is indiscriminate and so has the potential to also remove vectors that are a product of genuine slope movement. Working under the assumption that erosion filtering will remove most of the noisy vectors and only a small portion of slope movement vectors, the results can then be run through a counter process called dilation filtering. As the name suggests dilation expands the mask where filtered (and non-erroneous) slope movement is detected. This procedure effectively restores the full PIV dataset in areas not affected by feature edge effects. The erosion and then dilation filtering of vector outputs successfully eliminates most of the non-slope movement vectors, but occasionally small numbers of noisy vectors remain and could potentially still trigger a false alarm. This is particularly problematic for scenarios where false alarms lead to direct costs such as the closure of an asset like the A83 or mobilization of geotechnical staff to conduct in-person evaluation.
The image generated through erosion-dilation filtering is subsequently overlaid onto the original, non-filtered vectors produced by PIVlab. This processed image serves as a selective mask, isolating regions where authentic slope movement has been detected. As a result, only vectors corresponding to these masked regions are retained, effectively eliminating extraneous data. This, stepwise filtering process is demonstrated in Figure 2, where the input and output of the filters are displayed.
Ref: Khan MW, Dunning S, Bainbridge R, Martin J, Diaz-Moreno A, Torun H, Jin N, Woodward J, Lim M. Low-Cost Automatic Slope Monitoring Using Vector Tracking Analyses on Live-Streamed Time-Lapse Imagery. Remote Sensing 2021; 13(5):893.
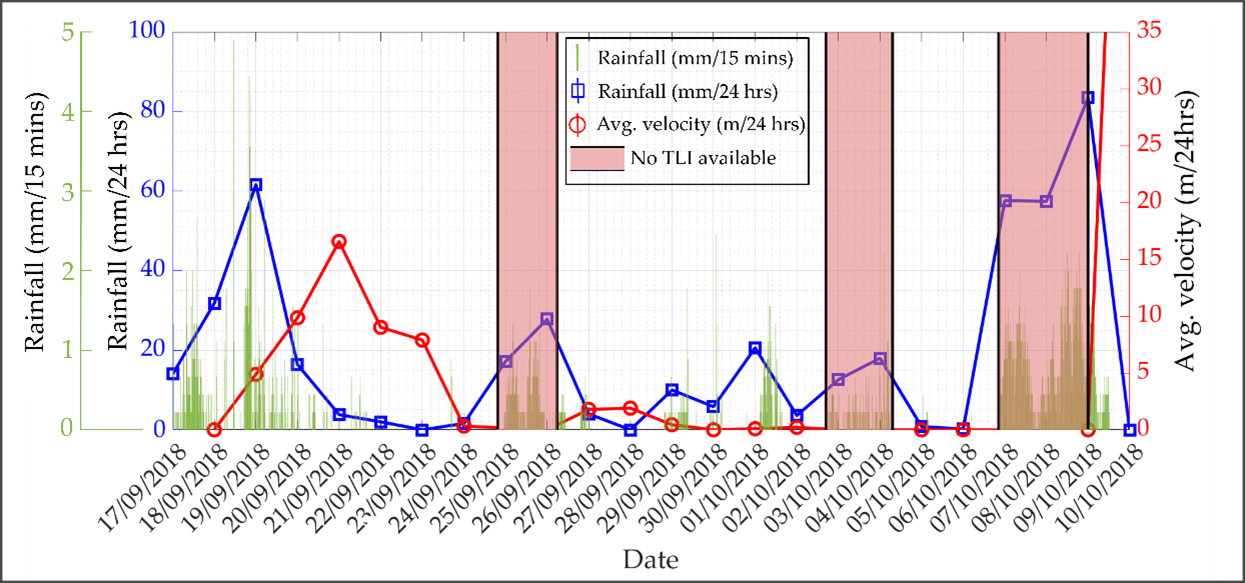
In September 2018, a ‘slope creep’ landslide was triggered as a consequence of precipitation induced by Storm Ali, a meteorological event that impacted the United Kingdom and Ireland in the same year. The time lapse imagery (TLI) data, gathered over a span of 20 days leading up to the landslide event, indicated a consistent pattern of creeping motion. This movement was successfully identified through the utilization of PIVlab software. Initial detection of this motion by PIVlab occurred on September 19, 2018, and was subsequently corroborated by a series of TLIs that consistently indicated movement. Figure 3 presents a sequence of TLIs, which were generated by processing pairs of images taken 24 hours apart. Furthermore, TLIs sampled on an hourly basis from September 21, 2018, are displayed to illustrate that the creeping movement was also discernible on more granular timescales. On October 9, 2018, a debris-flow originating from a higher elevation on the Rest and Be Thankful slope overwhelmed the area where the creeping motion had been previously observed, as depicted in Figure 3, under the section labelled "post-landslide”.
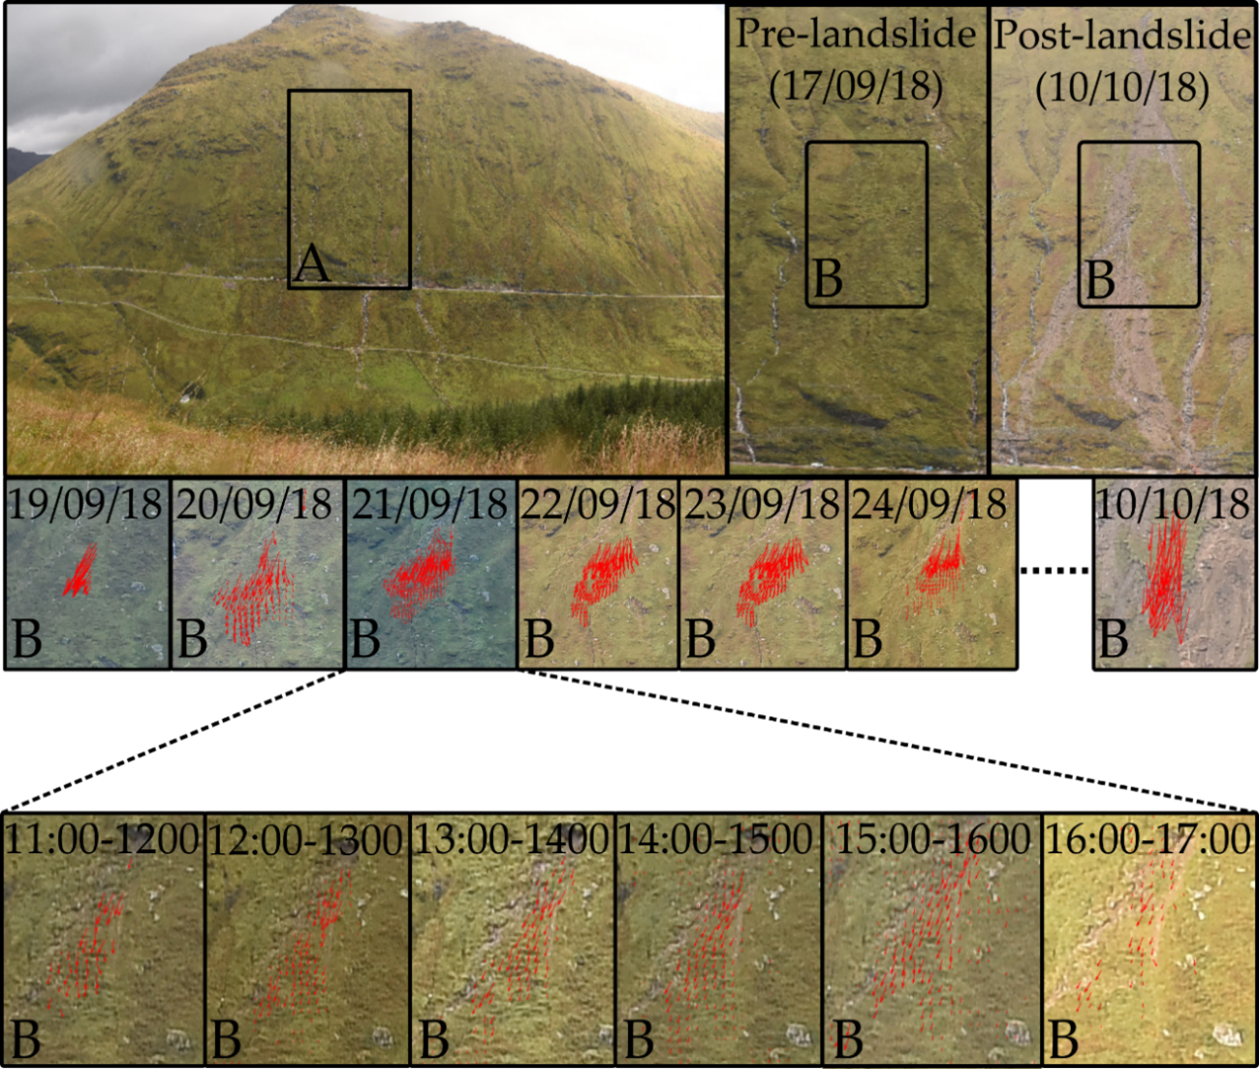
Ref: Khan MW, Dunning S, Bainbridge R, Martin J, Diaz-Moreno A, Torun H, Jin N, Woodward J, Lim M. Low-Cost Automatic Slope Monitoring Using Vector Tracking Analyses on Live-Streamed Time-Lapse Imagery. Remote Sensing 2021; 13(5):893.
The onset of the slope movement, as identified by Particle Image Velocimetry, demonstrates a correlation with the apex of rainfall, measuring 60mm in the preceding 24-hour period, attributable to Storm Ali on September 19, 2018. This relationship is graphically represented in Figure 4, where daily precipitation levels are juxtaposed with the average velocity of slope movement, as captured by PIVlab, based on 24-hour intervals of TLI data. Subsequent to its initiation, the velocity of the movement exhibits a near-linear escalation, notwithstanding a decline in rainfall. The maximum velocity manifests a temporal lag of approximately 48 hours following the peak rainfall, before attenuating to a null state. Examination of Figure 4 further reveals that the landslide exhibits limited responsiveness to intermittent rain events following the initial event. A marked acceleration in movement is only discernible following a second episode of high-intensity precipitation, during which 80mm of rainfall is recorded on October 9, 2018. On this date, two separate debris-flows emerge from the lower peripheries of the creeping movement zone; however, the primary mass of the creeping movement does not transition into a full-fledged debris-flow.
Ref: Khan MW, Dunning S, Bainbridge R, Martin J, Diaz-Moreno A, Torun H, Jin N, Woodward J, Lim M. Low-Cost Automatic Slope Monitoring Using Vector Tracking Analyses on Live-Streamed Time-Lapse Imagery. Remote Sensing 2021; 13(5):893.
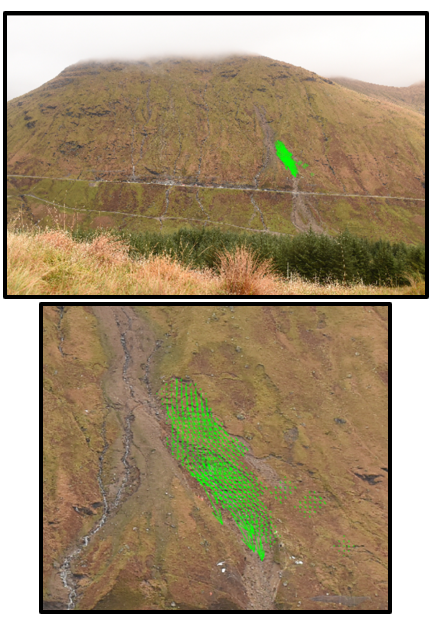
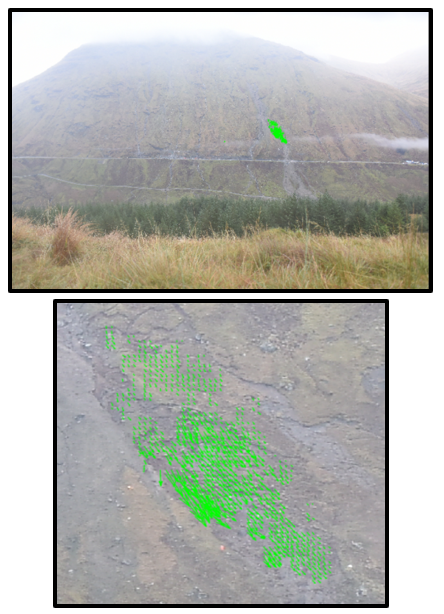
In November of 2020, in association with an intense precipitation event, another instance of slope creep was observed and documented by PIVlab. The observed movement persisted over an extended period, spanning multiple days. Notably, this particular occurrence did not escalate into a full-scale landslide event. The visualized PIVLab output corresponding to this observed movement is displayed in Figure 5.
Figure 5. PIVlab output between 24-27 November, 2020
Accessing live images
To enable the processing of live captured images, a new feature was implemented that allows users to establish a connection between the software and cloud-based services such as Google Drive. This connection facilitates the automatic downloading of images from the cloud and enables real-time processing. Consequently, the images captured by the camera on-site are uploaded to the cloud software and subsequently downloaded by the software for further processing.
Alert notification
The software has now been enhanced with a real-time alert system that can be run on a networked machine to produce automatic email notifications for stakeholders when movement is detected. By setting a threshold in the software using vector strength (magnitude) and quantity (volume), email notifications can now be generated when the threshold is exceeded. This new feature has been designed providing timely and actionable information to stakeholders and any number of recipients can now be added to the alert list (Figure 6). The inclusion of this alert system demonstrates the commitment to developing a comprehensive landslide monitoring solution that provides both accurate data analysis and effective communication to stakeholders. The final established workflow of PIVlab for slope monitoring is presented in Figure 7.
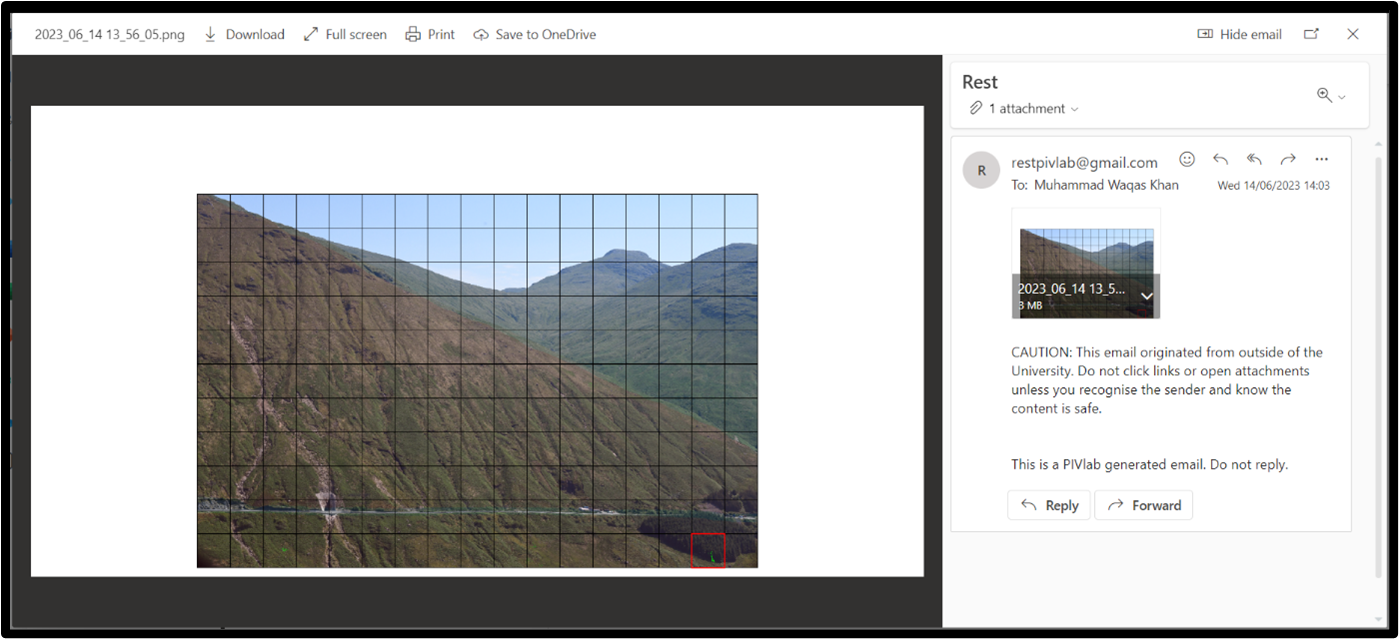
Figure 7. Final workflow of PIVlab algorithm
- Input images
- Initialisation
- Select ROI
- Choose IAs
- Set K and T
- Pre-processing
- CLAHE
- Intensity capping
- Image registration
- PIV
- Post-processing
- Erosion
- Dilation
- Cosine comparator
- Alert notification
- Threshold detection
- Email notification
- Output frame
- (Back to start)
Ref: Khan MW, Dunning S, Bainbridge R, Martin J, Diaz-Moreno A, Torun H, Jin N, Woodward J, Lim M. Low-Cost Automatic Slope Monitoring Using Vector Tracking Analyses on Live-Streamed Time-Lapse Imagery. Remote Sensing 2021; 13(5):893.
Limitations
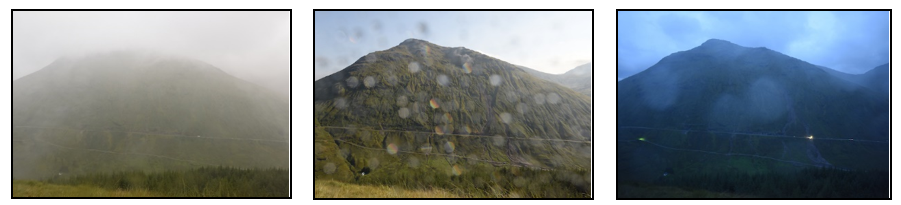
The new software developments implemented have significantly reduced the occurrence of false positives. Nonetheless, it was observed that PIVlab's performance was still affected in poor visibility conditions, particularly when there was cloud/mist/fog between the camera and the slope being monitored. Figure 8, demonstrates some examples where fog, raindrops and poor lighting effect the TLI imagery.
This phenomenon caused the software to produce less reliable data, requiring a manual adjustment to the thresholds for monitoring in such conditions. Despite this, the software modifications represent a significant step towards improving landslide monitoring capabilities, particularly when visibility is clear. Further work is required to enhance the software's performance in challenging weather conditions and to expand its potential for use in a wider range of monitoring scenarios. It was observed that the software's monitoring capabilities were limited at night due to the absence of visible light. In response, a near infrared (NIR) camera, capable of analysing slope conditions in low-light and night-time environments was trialled.
Near infra-red time lapse imagery
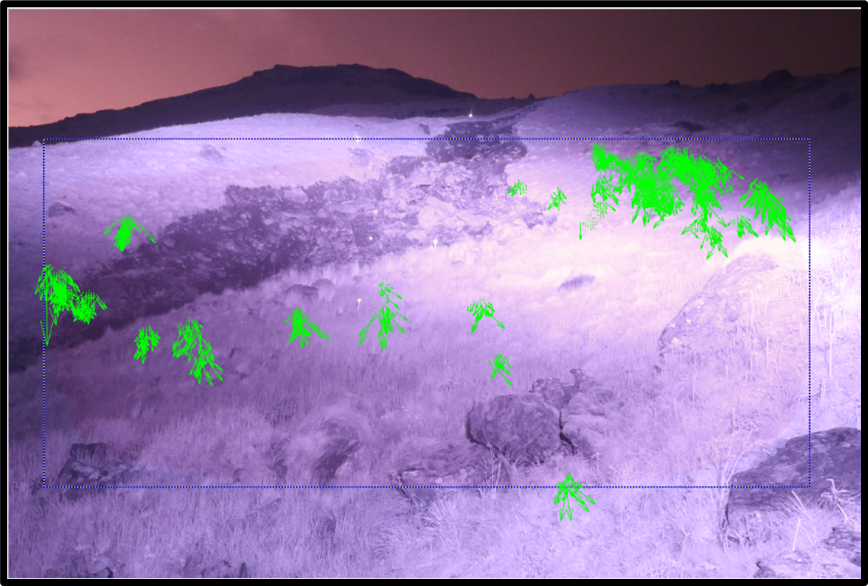
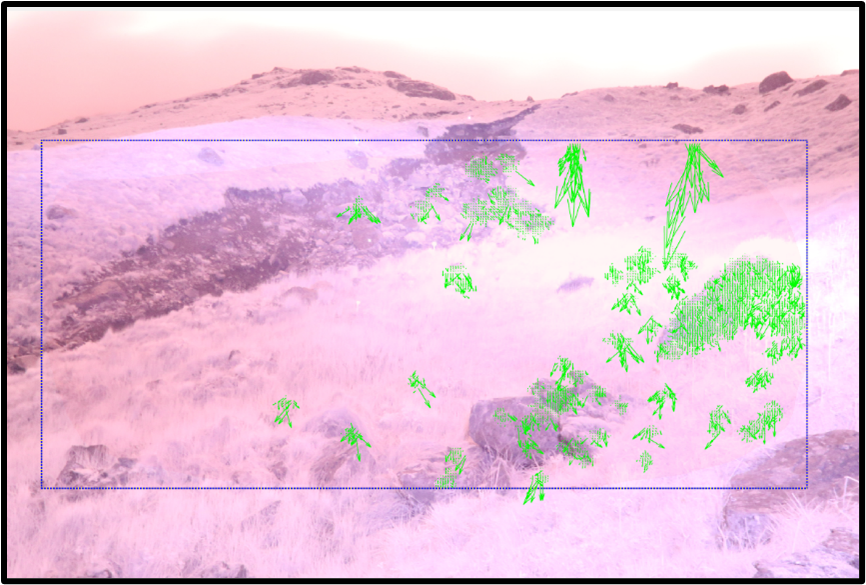
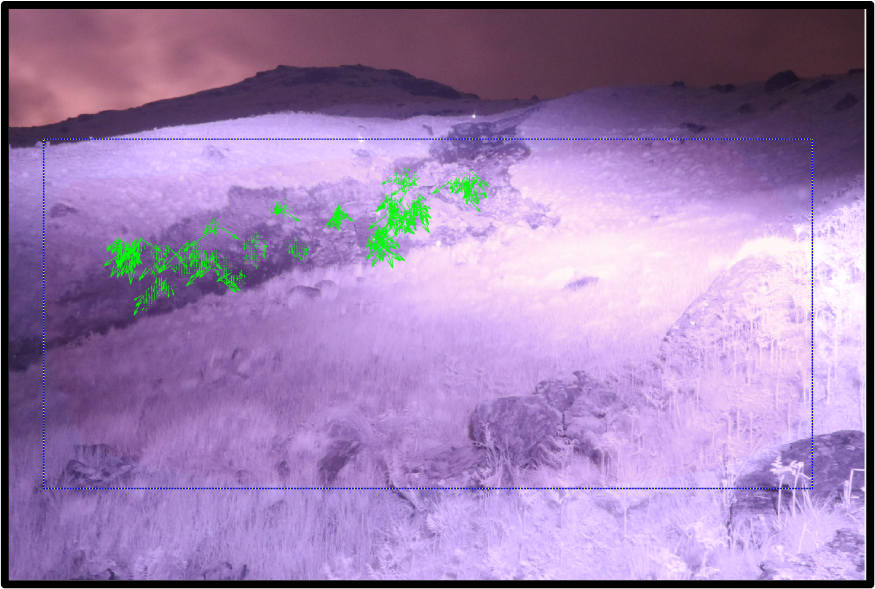
A near-infrared camera system was implemented to address the inherent challenges of obtaining high-quality imagery in low-light settings. Despite its advantages, this technological solution introduces additional complexities. One such issue is the significant alteration in image attributes like brightness and contrast when conditions transition from low ambient light to complete darkness. Our software currently identifies these fluctuations as noise, thereby complicating subsequent image analysis processes. Figure 9 showcases representative examples of these brightness and contrast variations, while Figure 10 illustrates how the software misconstrues these elements as potential movement. The addition of a NIR camera potentially provides continuous, accurate and reliable data analysis across a range of environmental conditions, but further work is required to balance the use of infrared floodlights, targets and coverage for optimal monitoring during low visibility conditions.
A suggested future direction of research is to co-locate the NIR camera on the opposite valley side with daytime RGB systems to evaluate the ability to capture imagery from a slope-wide perspective. This also opens up the possibility of multiple, mobile, NIR floodlights to illuminate areas of concern on demand.
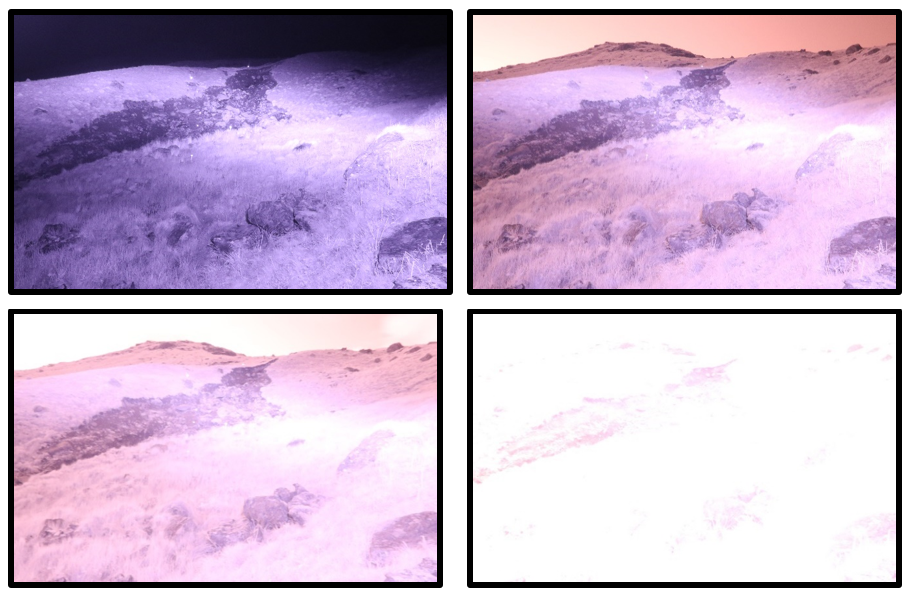
Figure 10. PIVlab output for close-range NIR time lapse imagery