4 What have been the consequences of these changes in travel behaviour?
4 What have been the consequences of these changes in travel behaviour?
Overview
The previous chapter highlighted the significant growth in (predominantly car-based) travel as a result of the introduction of RET. This chapter explores the consequences of this growth and the changes in travel behaviour associated with it.
How much fuller did the vessels become?
From the data provided, it is difficult to calculate a definitive load factor, due to a number of reasons set out below:
- The data is recorded in three categories: car, coach and commercial vehicles, with the latter two only also recorded as lane metres. The ‘car’ category includes vans, trailers, caravans, mortorhomes etc. so we cannot be precise about how many lane metres a given car loading level would imply.
- The deployment of mezzanine decks is not systematically recorded for each sailing, we have assumed that a high volume of commercial vehicles will preclude deployment and hence reduce the lane metres available, based on the vessel characteristic provided by CalMac.
- Some vessels have areas of the vehicle deck which are restricted to certain vehicle types which can impact on the use of space.
- It is not noted when the ferry’s vehicle deck is fully used, with no further space available.
With these caveats, we have estimated a ‘load factor’ based on PCU (passenger car units) carryings and capacity per vessel (i.e. for each route in each season, we have estimated the median usage of the car deck, indicating as a percentage how much of the car deck is taken-up). These are presented in a set of ‘box and whisker’ charts for each route.
Box and Whisker Plots Explained: The box and whisker diagrams that follow throughout this chapter show the distribution of sailings’ individual vehicle deck load factors by season. These ‘box and whisker’ diagrams include load factors (i.e. how full the car deck is) for every sailing in the three season timetables. Taking each component of the diagram in turn:
- each point represents the load factor of an individual sailing
- each sailing is then allocated to one of four quarters, with an equal number of sailings in each quarter
- those points below the box represent the least busy quarter of sailings, whilst those above the box represent the busiest quarter of sailings
- the box therefore covers the ‘middle’ two quarters, with the horizontal line within the box representing the median load factor. The ‘X’ in the box is the mean load factor
- the short horizontal lines at the top and bottom of the chart (i.e. the whiskers), represent either the maximum or minimum load factor
- note that points above or below these lines as classed as ‘outliers’ in this statistical approach
- so, the higher on the chart and the shorter the ‘box’, the more sailings there are where the ferry is close to capacity
It should be noted that, on some sailings, the load factor may exceed 100%. This is due to the composition of traffic on the ferry and its arrangement on the deck - in the event, for example, that a sailing is dominated by smaller than average cars, it may be possible to board more cars than the vessel’s theoretical capacity, which is based on an average car length.
The load factor is based on (i) converting CV & coach metres to passenger car units (PCU), a means of equating all vehicles to an average car length; (ii) adding these to the car PCUs; and (iii) applying the total PCUs to the vessel capacities provided by CalMac Ferries Ltd. There was also an assumption made that if total CV and coach lane meterage was above certain thresholds, it impacts on the ability to deploy the mezzanine decks (on vessels which have them), thus reducing the overall capacity of that sailing.
Firth of Clyde
The figures below illustrate the changes in median load factor on the Firth of Clyde Routes between the RET Year-1 (dark) and RET Year+1 (light).
Figure 4.1: Firth of Clyde Routes – change in median load factor by season (RET year -1 versus RET year (+1)
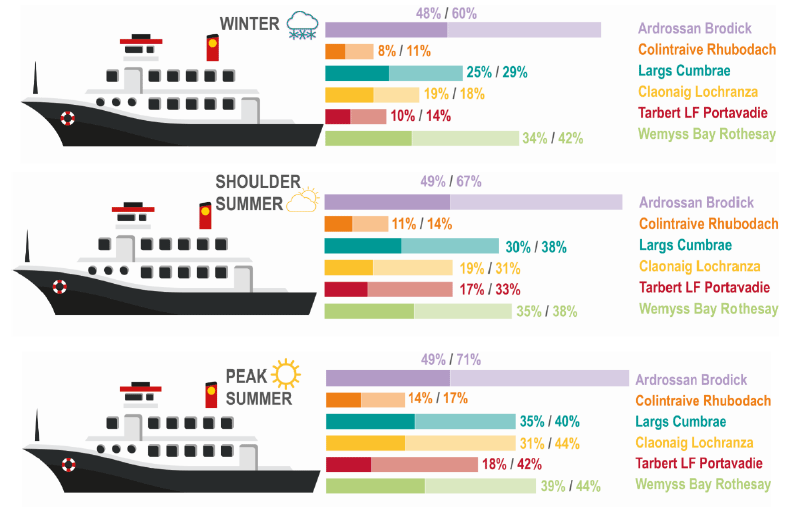
- The charts above indicate the changes in median load factors for the vehicle decks of the vessels serving each of the routes. This statistic provides an overview of how close to capacity the vessels are across the year. The comparison is between the median capacity during the RET Year-1 and RET Year+1.
- The median load factor has increased most significantly on the Ardrossan – Brodick route, with median load factors in the summer suggesting that several sailings are either fully or close to fully utilised.
- Whilst the median load factor has increased on all other routes, there are few evident capacity utilisation issues otherwise.
Ardrossan – Brodick box and whisker chart
Figure 4.2: Ardrossan Brodick box and whisker chart
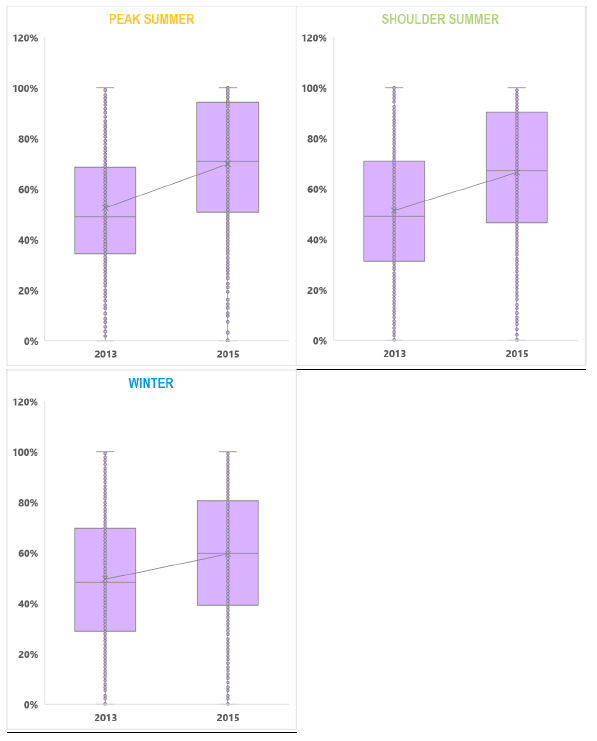
- Load factor (Y-axis) on the Ardrossan – Brodick route has increased across all seasons.
- Shoulder and peak summer utilisation have increased to the extent that a higher proportion of sailings are becoming capacity constrained.
- The two vessel solution in the peak summer months broadly allows the shoulder-peak utilisation to be maintained, but significant capacity pressures do remain.
Colintraive – Rhubodach box and whisker chart
Figure 4.3: Colintraive – Rhubodach box and whisker chart
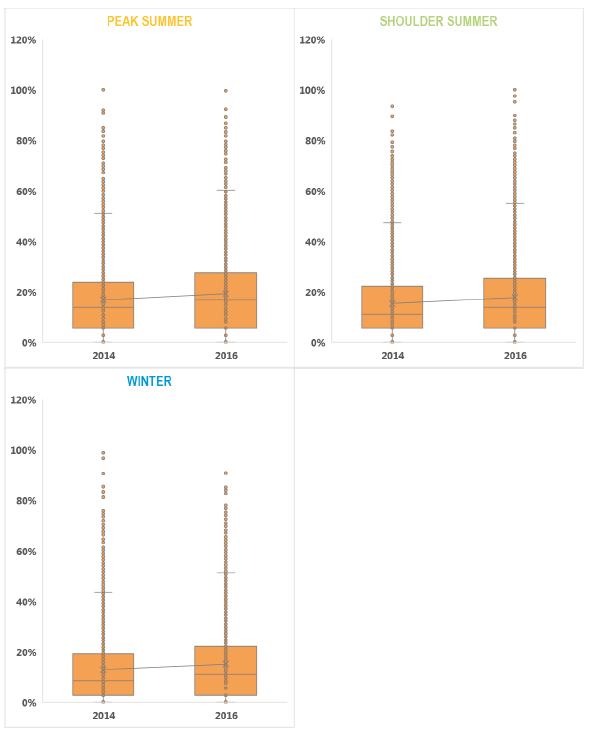
- Utilisation on the Colintraive – Rhubodch route has increased across all seasons.
- There are however no notable capacity problems on this route.
Claonaig – Lochranza box and whisker chart
Figure 4.4: Claonaig - Lochranza box and whisker chart
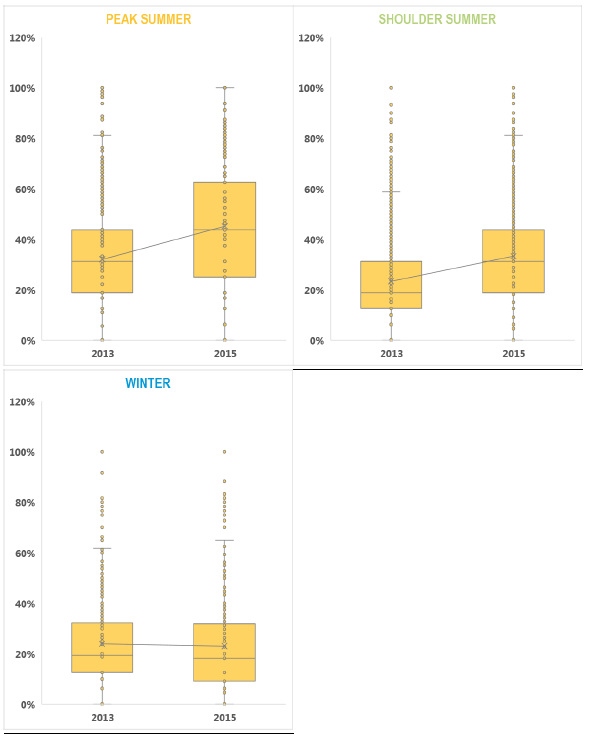
- Utilisation on the Claonaig - Lochranza route has increased across all seasons.
- Peak summer utilisation has increased significantly, reflecting the strong overall summer growth in that season.
- There are however no notable capacity problems on this route.
Largs – Cumbrae box & whisker chart
Figure 4.5: Largs - Cumbrae box and whisker chart
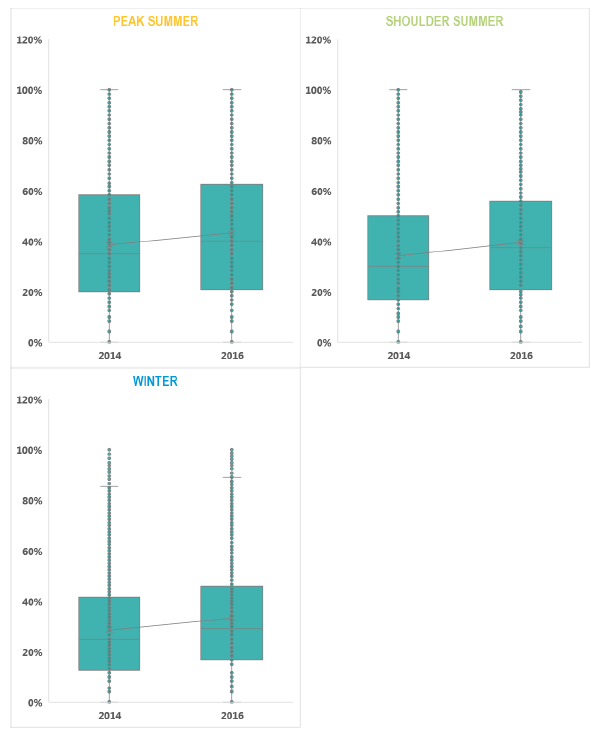
- Utilisation on the Largs - Cumbrae route has increased across all seasons, although the scale of the increase has been less than on the Ardrossan – Brodick route despite high summer daytripper demand.
- There are no evident capacity utilisation problems on this route, with the deployment of a second vessel in the summer months allowing demand to be met.
- However, the survey suggests that queues can emerge at peak times due (e.g. Summer Saturdays) to the vehicle deck being full.
Tarbert LF – Portavadie box and whisker chart
Figure 4.6: Tarbert LF - Portavadie box and whisker chart
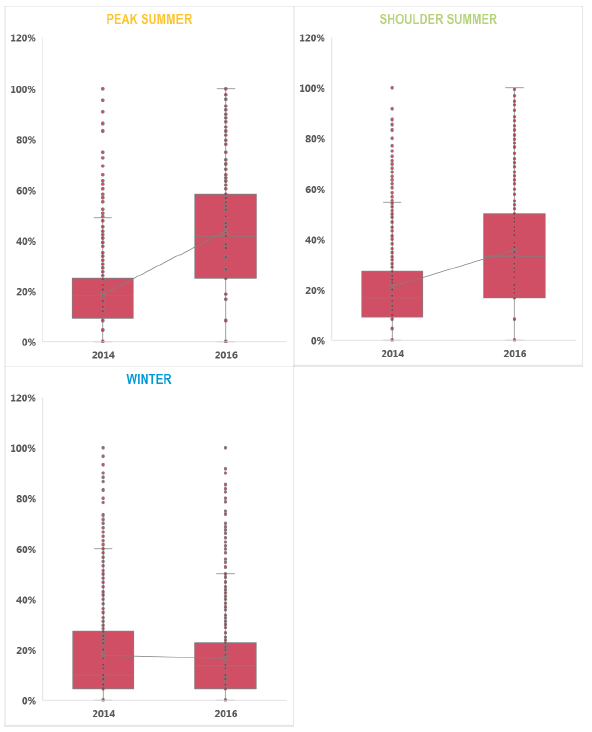
- Utilisation on the Tarbert LF – Portavadie route has increased across all seasons, with particularly strong growth in the shoulder and peak summer. This highlights the strong tourist demand on this route, and possibly the growth in coach traffic.
- Whilst overall growth has been strong, there are however no notable capacity problems on this route.
Wemyss Bay – Rothesay box and whisker chart
Figure 4.7: Wemyss Bay - Rothesay box and whisker chart
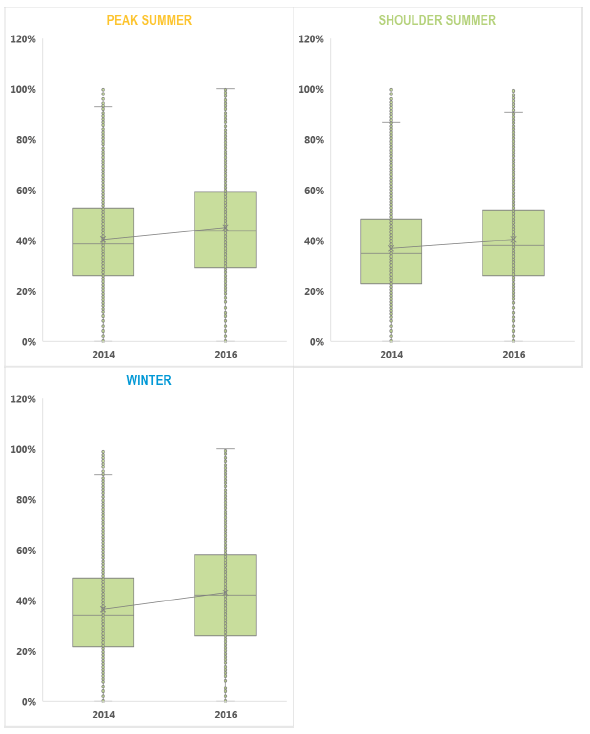
- Despite the introduction of RET, median vehicle deck utilisation has only increased marginally, and by a broadly similar amount across all three seasons. This may reflect the commuter traffic that utilises this route year round.
Firth of Clyde: Peak summer Saturdays box and whisker charts
The box and whisker charts below illustrate the changes in load factors for Saturdays during the Summer Peak (July & August)
Figure 4.8: Peak Summer Saturday box and whisker chart
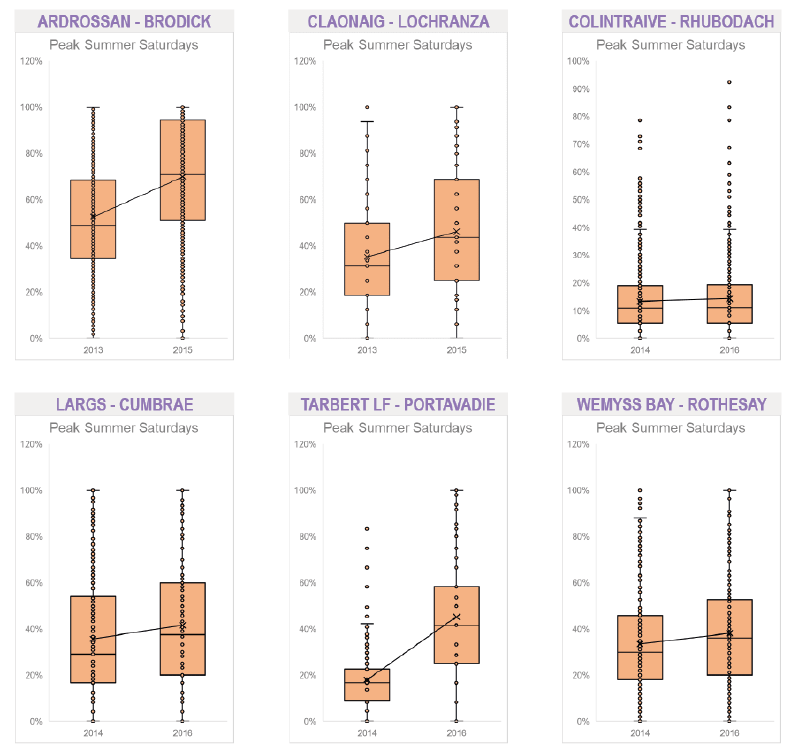
- As can be viewed in the diagrams, Saturday sailings became busier across almost all routes in the Firth of Clyde, in particular the Arran routes, with the Ardrossan - Brodick route witnessing an increase in median load factors from 49% to 71% and Claonaig - Lochranza witnessing increases from 31% to 44%.
Southern Hebrides
The figures below illustrate the changes in median load factor on the Southern Hebrides Routes between the RET Year-1 (dark) and RET Year+1 (light).
Figure 4.9: Southern Hebrides Routes – change in median load factor by season (RET year -1 versus RET year (+1)
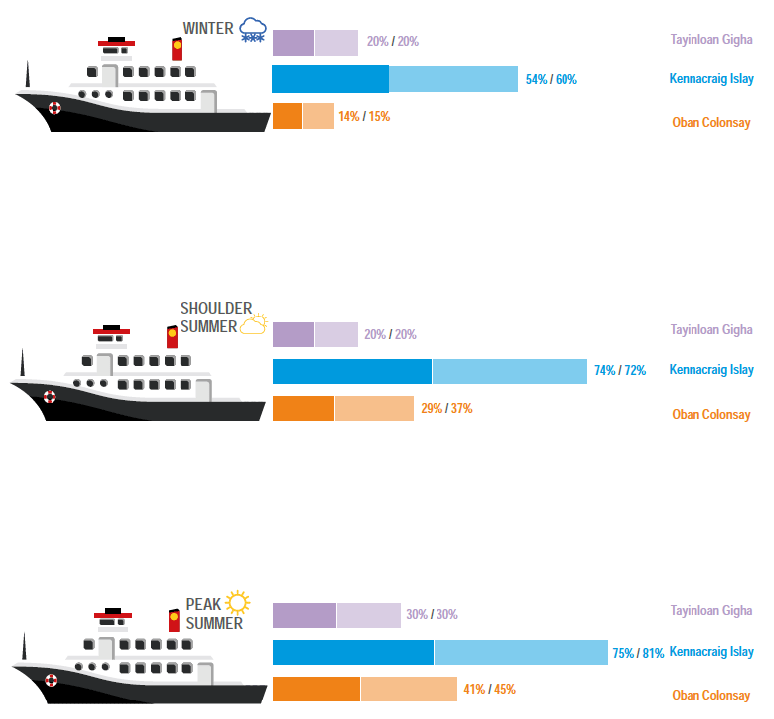
- Whilst the growth in the median load factor on the Islay route has been relatively modest across all three seasons, this growth has been layered on top of already busy sailings and thus has heightened the capacity pressure on the route. There is very little head room for further vehicle growth, particularly in the shoulder and peak summer periods.
- The median load factor has increased on the Oban – Colonsay route, but on average the vehicle deck on Colonsay sailings is typically less than half full.
- Median vehicle deck utilisation has remained unchanged across all seasons on the Gigha route.
Tayinloan – Gigha box and whisker chart
Figure 4.10: Tayinloan - Gigha box and whisker chart
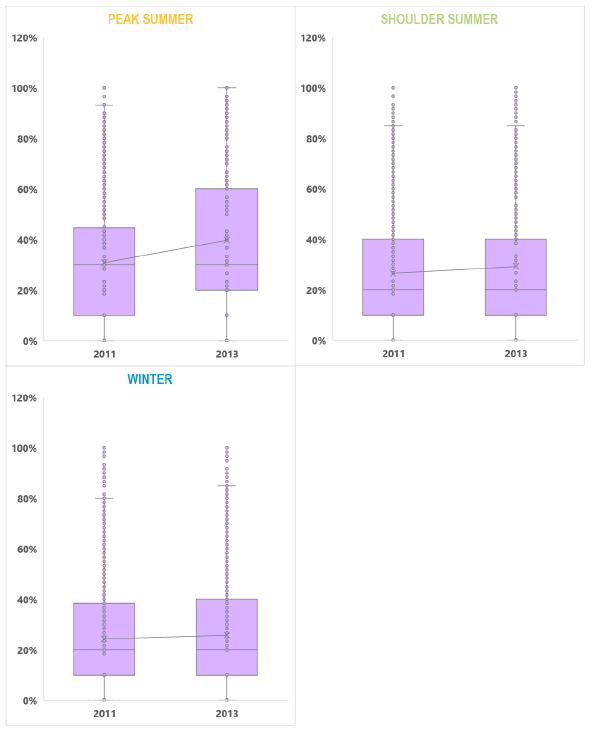
- There has been a marginal growth in peak summer vehicle deck utilisation, but there are no capacity issues on this route.
Kennacraig – Islay box and whisker chart
Figure 4.11: Kennacraig – Islay box and whisker chart
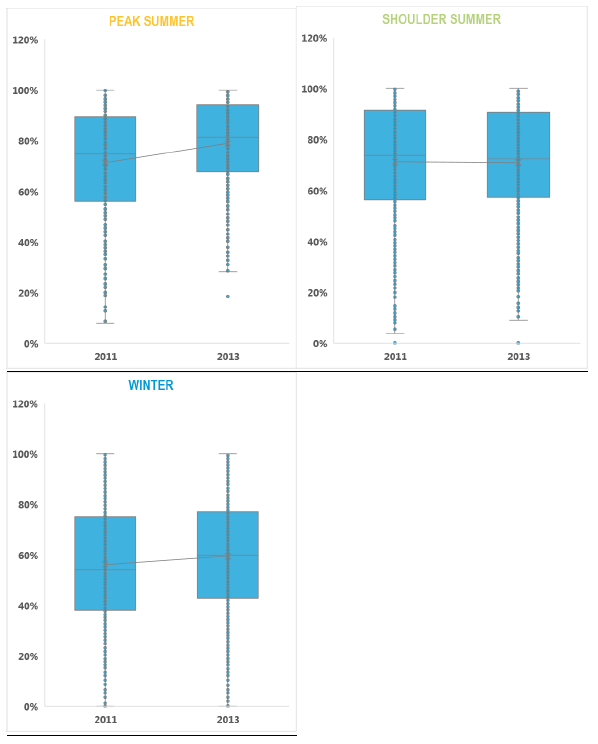
- The Kennacraig – Islay route is facing considerable capacity pressures, particularly in peak summer season. RET has amplified the capacity challenges on this route, leaving very little scope for further growth in car traffic.
Oban – Colonsay box and whisker chart
Figure 4.12: Oban – Colonsay box and whisker chart
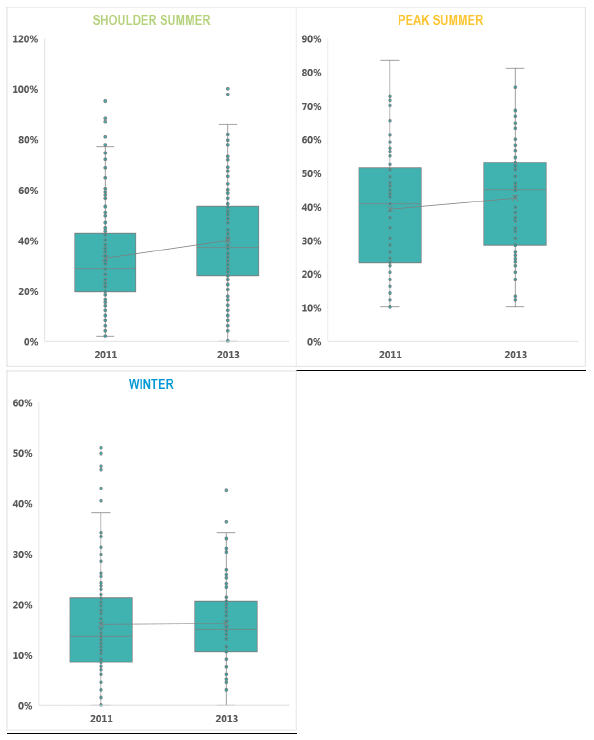
- Whilst capacity utilisation has increased on the Oban – Colonsay route in both the shoulder and peak summer seasons, there are no evident capacity problems on the route.
Southern Hebrides: Peak summer Saturdays box and whisker charts
Figure 4.13: Peak Summer Saturday box and whisker chart
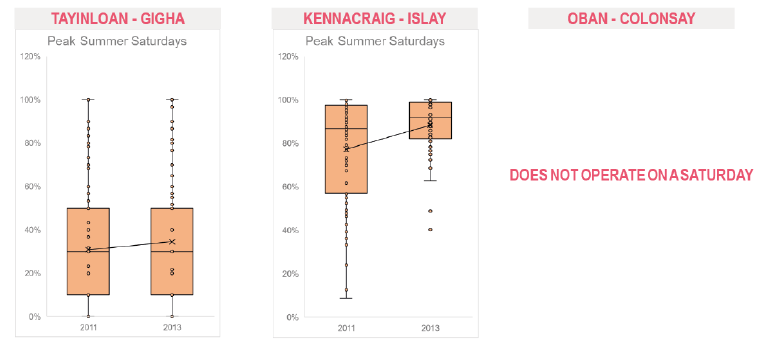
The peak Saturday sailings on the Kennacraig - Islay route increased from a median load factor of 89% prior to RET to 92% in the year following the introduction of RET.
Inner Hebrides
The figures below illustrate the changes in median load factor on the Inner Hebrides Routes between the RET Year-1 (dark) and RET Year+1 (light).
Figure 4.14: Inner Hebrides Routes – change in median load factor by season (RET year -1 versus RET Year (+1)
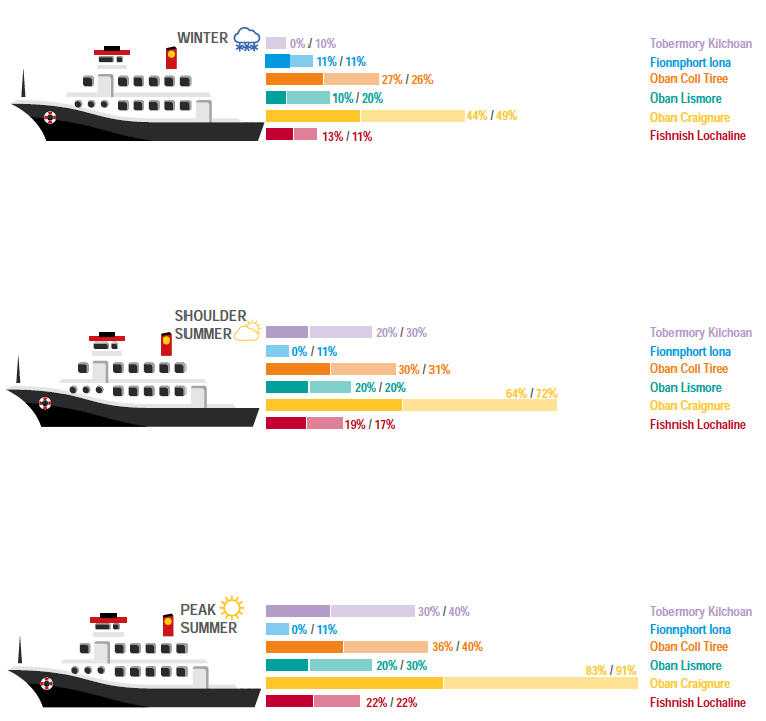
- Utilisation has grown across the Inner Hebrides network, although on most routes this can be readily accommodated.
- The increase in vehicle deck utilisation on Oban – Craignure is however significant, particularly in peak summer where it stands at 91% (this means that most sailings are effectively full, despite the introduction of a two vessel service).
Tobermory – Kilchoan box and whisker chart
Figure 4.15: Tobermory – Kilchoan box and whisker chart
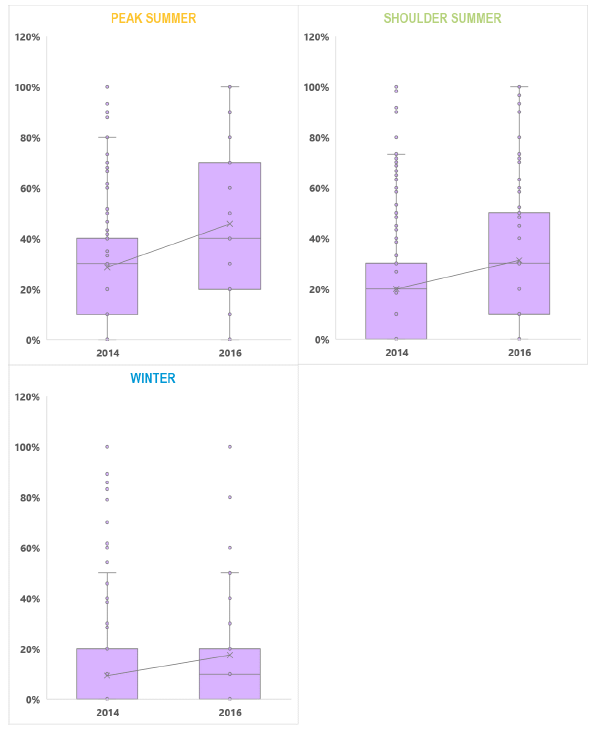
- Utilisation on the Tobermory – Kilchoan route has increased across all seasons, but particularly in the shoulder and peak summer timetable periods. There are however no notable capacity issues on the route.
Fionnphort – Iona box and whisker chart
Figure 4.16: Fionnphort – Iona box and whisker chart
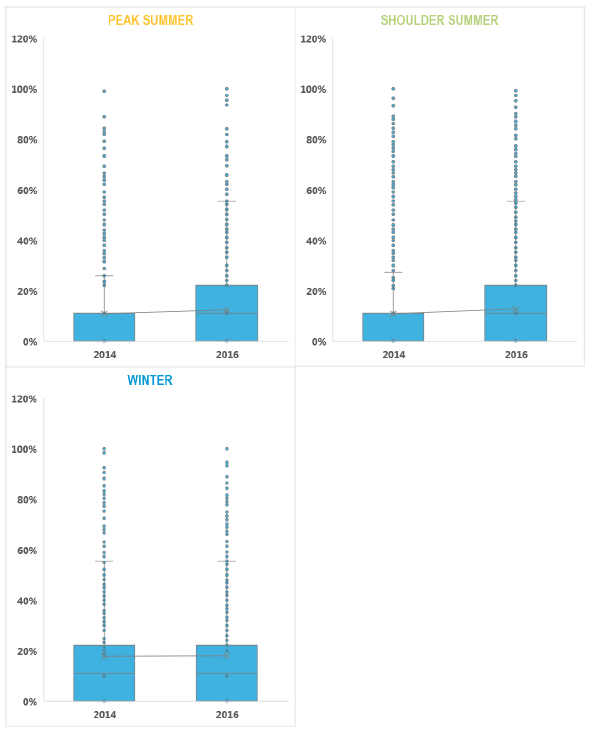
- Whilst utilisation on the Fionnphort – Iona route has increased across all seasons, and in particular the shoulder and peak summer periods, the island’s vehicle permit system means that utilisation is rarely higher than 20%.
Oban – Coll / Tiree box and whisker chart
Figure 4.17: Oban - Coll – Tiree box and whisker chart
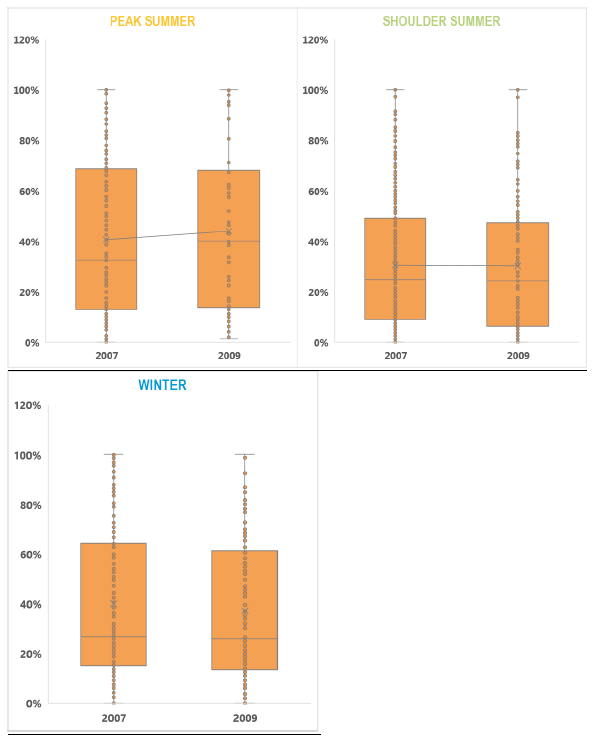
- Utilisation on the Oban – Coll / Tiree route has increased since RET was introduced but there remains some scope for growth on the route despite there being a number of high utilisation sailings.
Oban – Craignure box and whisker chart
Figure 4.18: Oban – Craignure box and whisker chart
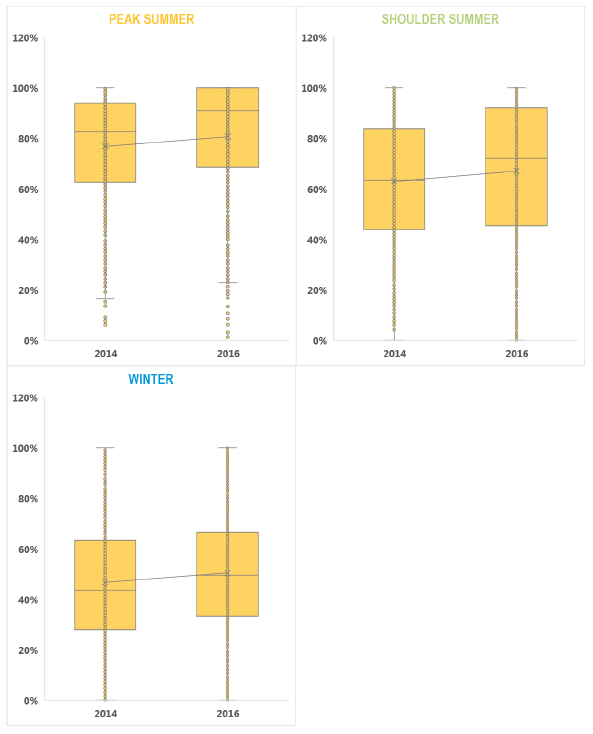
- Utilisation has also increased across all seasons on Oban – Craignure. The shoulder summer and, in particular, the peak summer season are experiencing significant capacity issues, with a high median load factor and many sailings full.
Oban – Lismore box and whisker chart
Figure 4.19: Oban – Lismore box and whisker chart
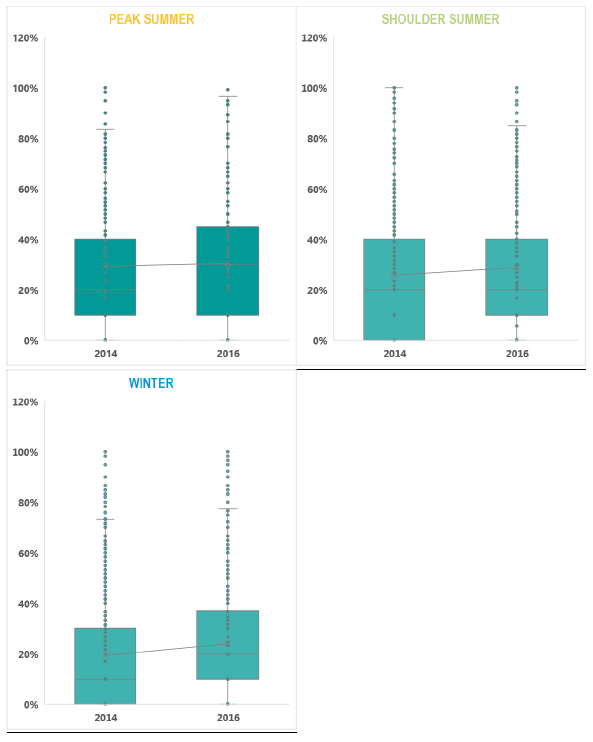
- Utilisation on the Oban – Lismore route has increased across all seasons, but particularly in the shoulder and peak summer timetable periods. There are however no notable capacity issues on the route.
Fishnish – Lochaline box and whisker chart
Figure 4.20: Fishnish – Lochaline box and whisker chart
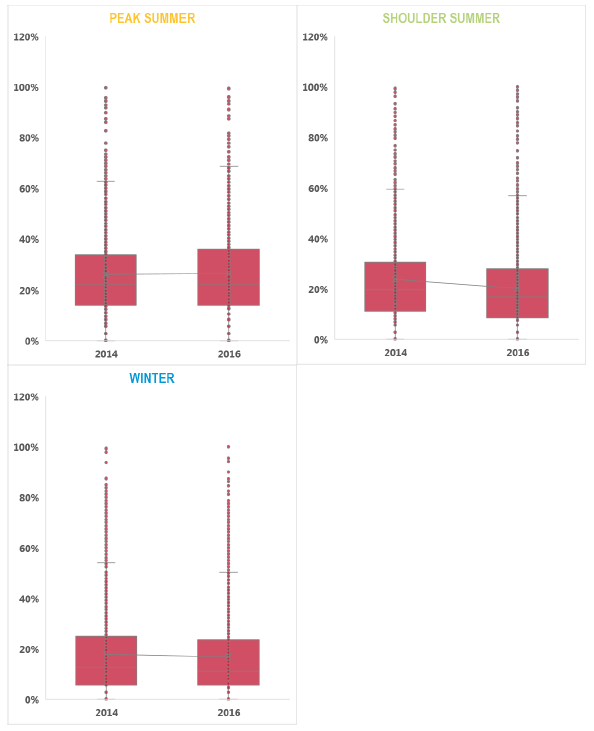
- The switch of journeys from Lochaline – Fishnish to the Oban - Craignure route means that utilisation has actually declined across all seasons, making this route something of a network outlier.
Peak summer Saturdays
Figure 4.21: Peak Summer Saturday box and whisker chart
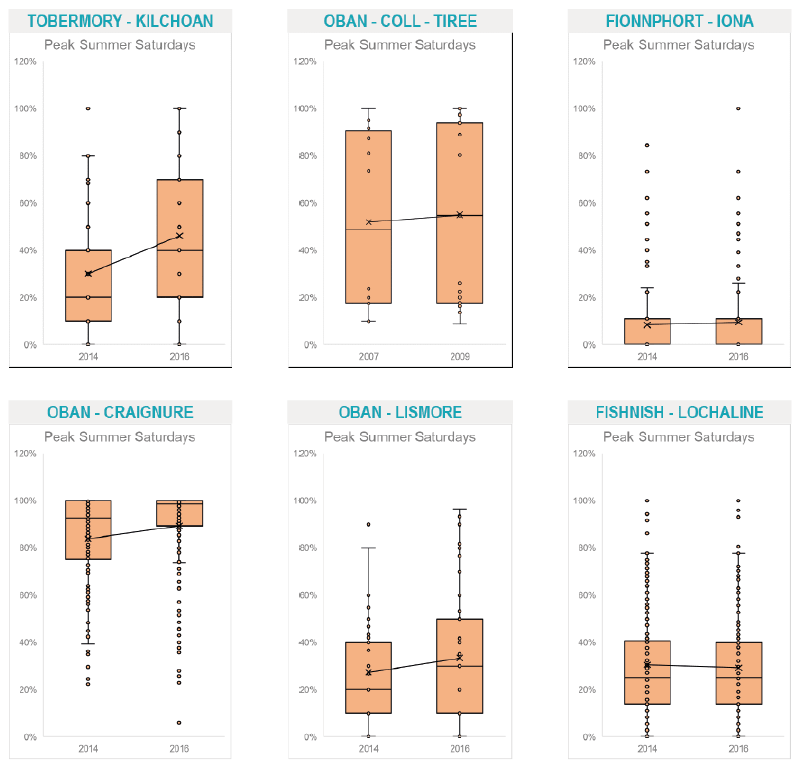
- As can be seen in the diagrams above, on peak Saturday sailings, there was a marginal increase in median load factors across all routes.
- The Oban - Craignure route in particular witnessed an increase from 93% to 98%, with most Saturday sailings nearly full during this period.
Skye, Raasay and the Small Isles
The figures below illustrate the changes in median load factor on Skye, Raasay and the Small Isles Routes between the RET Year-1 (dark) and RET Year+1 (light).
Figure 4.22: Skye, Raasay and the Small Isles – change in median load factor by season (RET year -1 versus RET Year (+1)
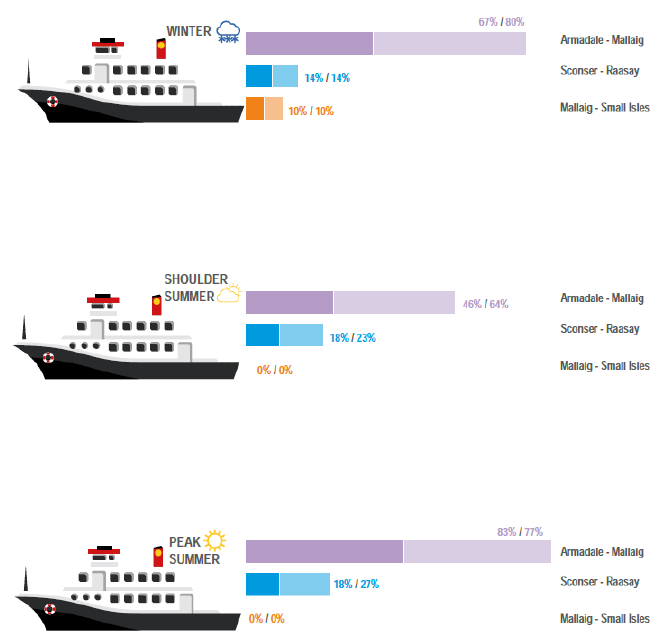
- The change in median utilisation on the Mallaig – Armadale route reflects a much wider range of factors than RET alone.
- In the winter months, median utilisation increased by 13% but this represents the low frequency on a capacity constrained vessel (13% accounting for around one extra car on average).
- The significant growth in shoulder summer utilisation reflects in large part the RET-related growth on the route.
- Peak summer utilisation has actually declined from 83% to 77%. Whilst peak summer car carryings have actually increased, the deployment of more capacity on the route in 2016 has facilitated the decline in the median load factor.
- The Sconser – Raasay route has experienced an increase in the median load factor across all three periods.
Figure 4.23: Armadale – Mallaig box and whisker chart
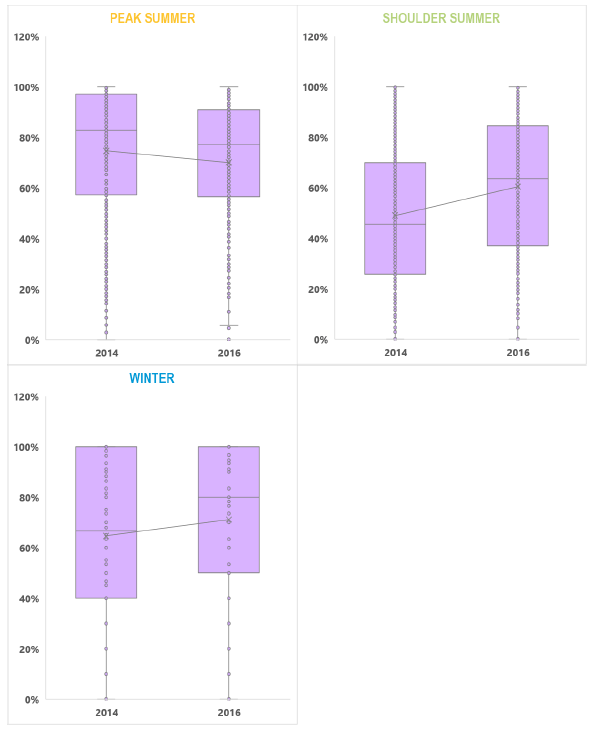
- There are capacity pressures on the route in the winter months, but this reflects the limited supply-side rather than a marked growth in demand (although there is evidence to suggest that increasing the sailing frequency or vessel capacity would stimulate additional demand).
- Capacity pressures have increased in the shoulder summer period, with a median load factor of 64% and several sailings at or near capacity.
- There are capacity pressures on this route in the peak summer period, with a median load factor of 77% and several sailings at or near capacity. However, the deployment of additional capacity from the summer 2016 timetable period has reduced pressure on the route (although this is also in part due to a reduction in coach traffic).
Sconser – Raasay box and whisker chart
Figure 4.24: Sconser – Raasay box and whisker chart
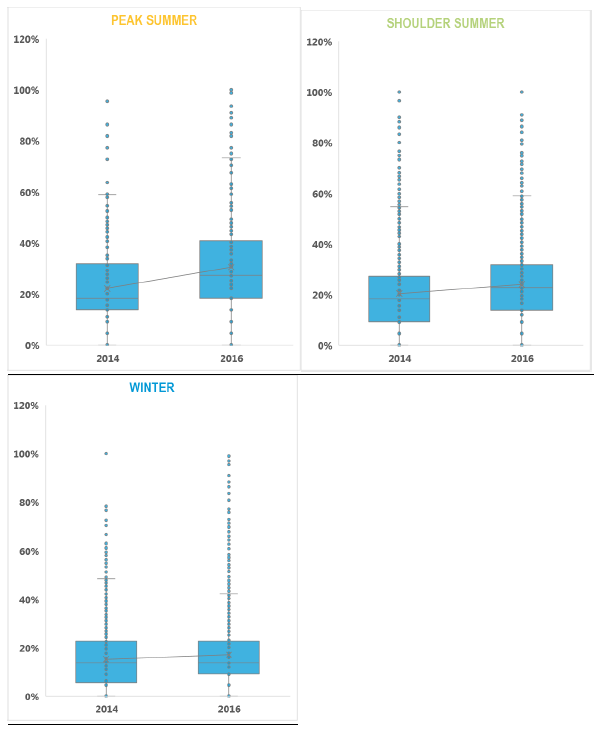
- Whilst utilisation has increased across all seasons on the Sconser – Raasay route, there are no evident capacity problems.
Mallaig – Small Isles box and whisker chart
Figure 4.25: Mallaig - Small Isles box and whisker chart
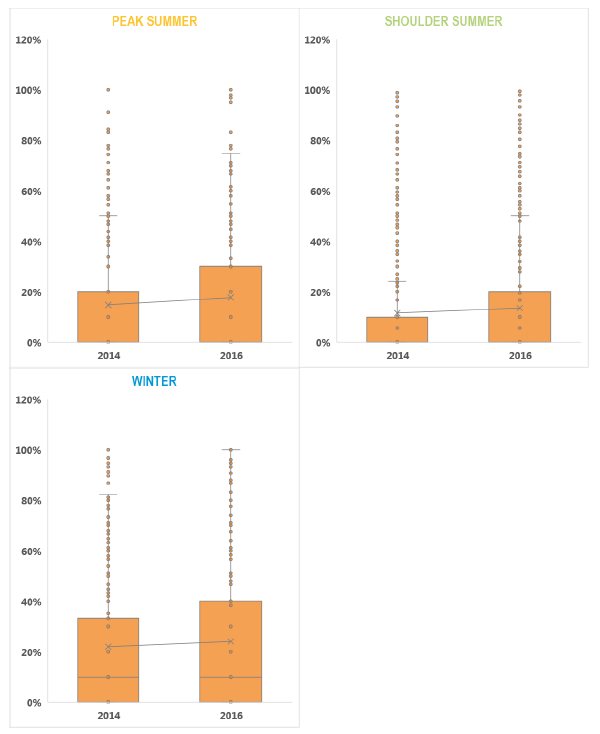
- Load factors have increased across all seasons on the Mallaig – Small Isles route, although vehicle deck capacity issues only occur on a handful of peak sailings.
Peak summer Saturdays
Figure 4.26: Peak Summer Saturday box and whisker chart
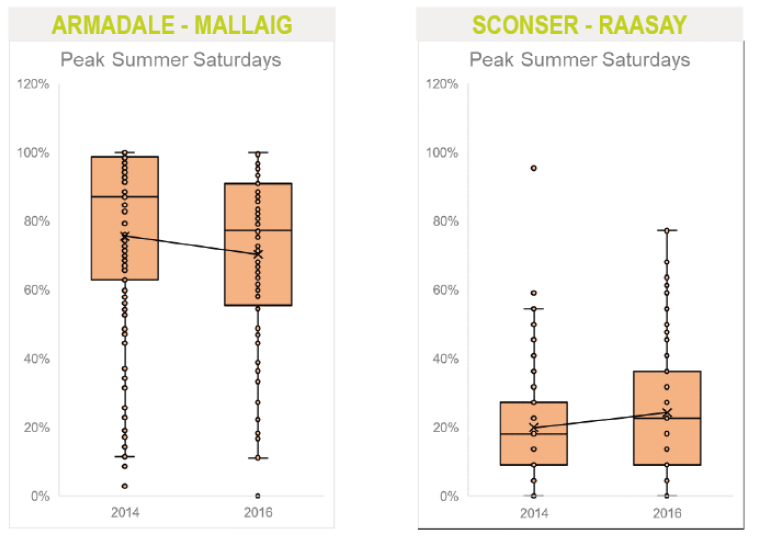
- Peak Summer Saturday sailings on the Sconser Raasay route seen an increase in median load factors from 18% to 23% in the summer following RET introduction.
Outer Hebrides
The figures below illustrate the changes in median load factor on the Outer Hebrides Routes between the RET Year-1 (dark) and RET Year+1 (light).
Figure 4.27: Outer Hebrides Routes – change in median load factor by season (RET year -1 versus RET Year (+1)
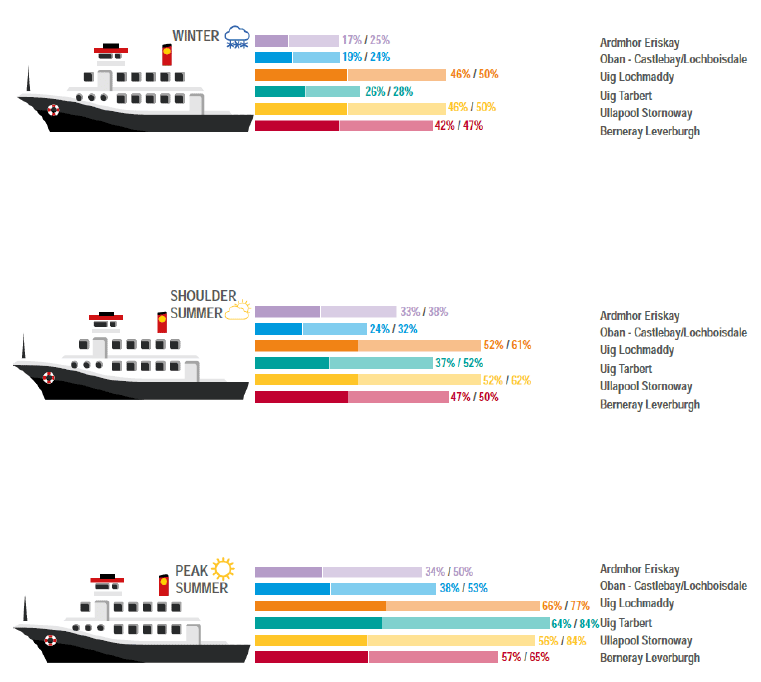
- Given the overall low travel volumes to and from the Outer Hebrides in the winter months, the increase in median load factors has been marginal.
- Median load factors increased much more strongly in the shoulder and peak summer months, particularly on the Uig Triangle and Stornoway – Ullapool routes, reflecting the strong and increasing visitor demand for Lewis and Harris.
Ardmhor – Eriskay box and whisker chart
Figure 4.28: Ardmhor – Eriskay box and whisker chart
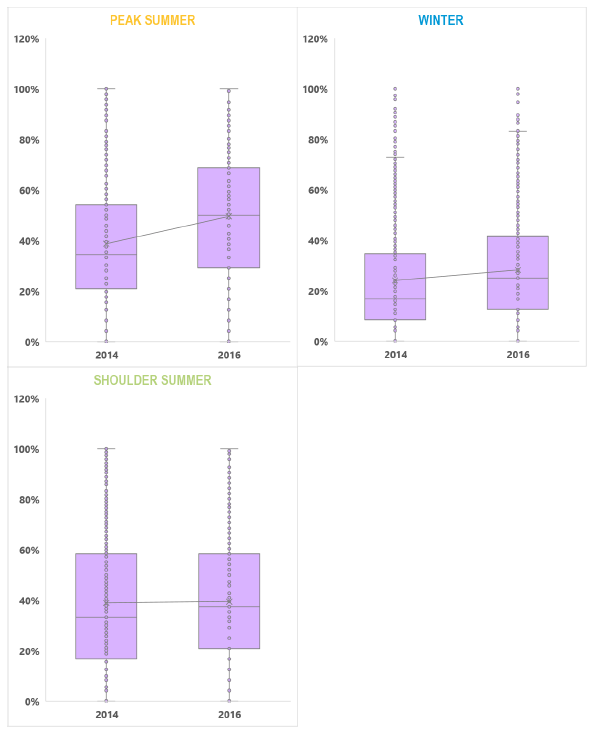
- Vehicle deck utilisation across all periods has increased on the Sound of Barra route, particularly in the peak summer period.
- The increase in CV movements across the Sound will be a contributing factor to higher vehicle deck utilisation.
- Whilst there has been strong growth on this route, there is generally sufficient capacity to accommodate demand, albeit some peak sailings will be full or near to full.
Oban – Castlebay/Lochboisdale box and whisker chart
Figure 4.29: Oban - Castlebay/Lochboisdale box and whisker chart
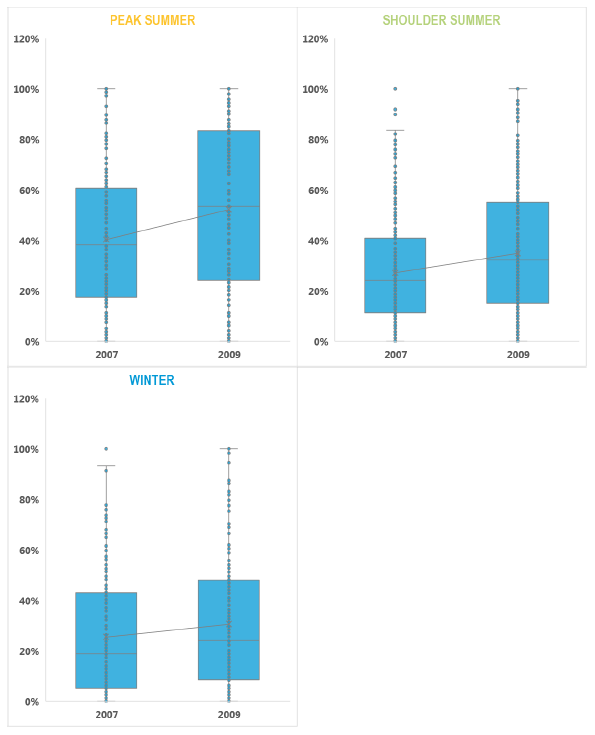
- Vehicle deck utilisation grew strongly across all periods on the Oban – Castlebay / Lochboisdale route. The large reduction in fares together with the extension of RET to CVs supported this growth.
- Whilst utilisation issues may have emerged on this route, the splitting of the triangle in 2016 into Castlebay – Oban and Lochboisdale – Mallaig, the deployment of a larger vessel on the former route and the introduction of a near daily timetable means that capacity is rarely an issue at present.
Uig – Lochmaddy box and whisker chart
Figure 4.30: Uig – Lochmaddy box and whisker chart
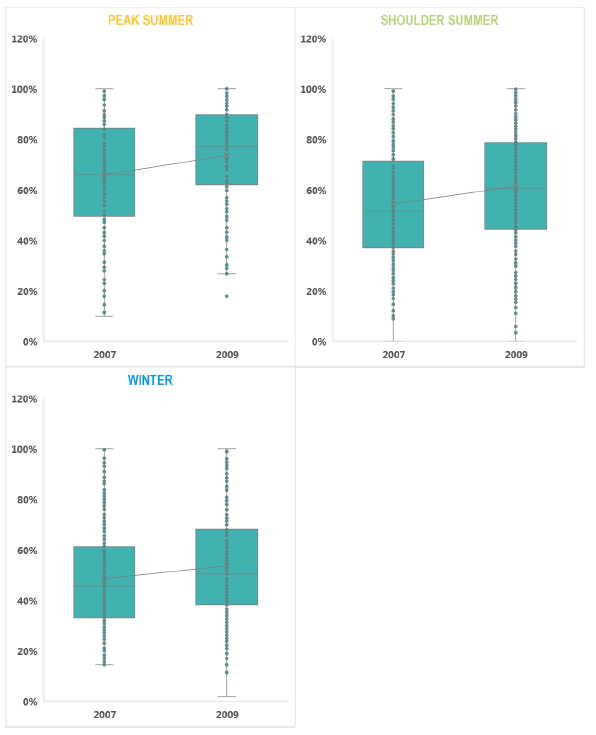
- There was likewise an increase in vehicle deck utilisation across all seasons on the Uig – Lochmaddy route, again supported to some extent by RET being available to CVs.
- Summer capacity pressures in particular became more prevalent following the introduction of RET.
Ullapool – Stornoway box and whisker chart
Figure 4.31: Ullapool – Stornoway box and whisker chart
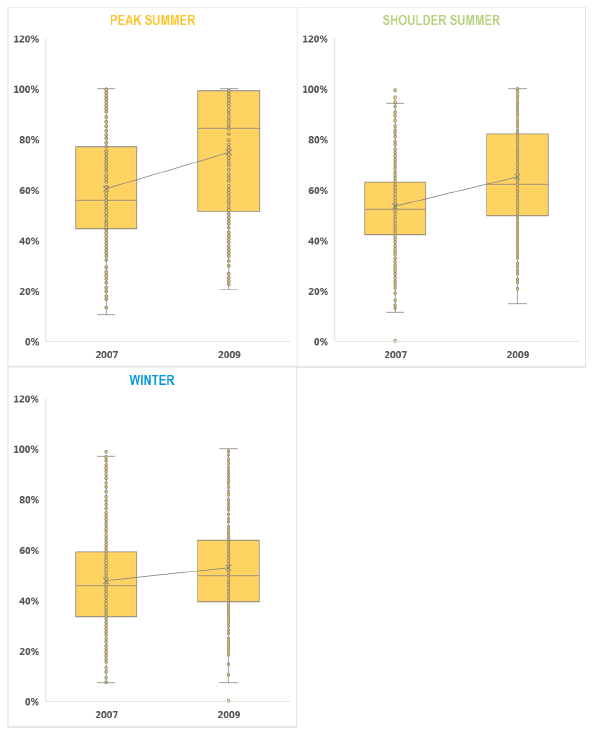
- Utilisation also increased across all periods on Stornoway – Ullapool, with a significant increase in peak summer. Whilst some of this increase may be related to RET for CVs, the majority of commercial traffic moved on the overnight freight vessel and thus the majority of the induced demand is car traffic.
- The capacity challenges on this route led to the introduction of the MV Loch Seaforth, which immediately alleviated the capacity challenges. However, the induced demand released by an enhancement of the supply-side (i.e. a new vessel) has re-applied and indeed increased this summer capacity pressure.
Uig – Tarbert box and whisker chart
Figure 4.32: Uig – Tarbert box and whisker chart
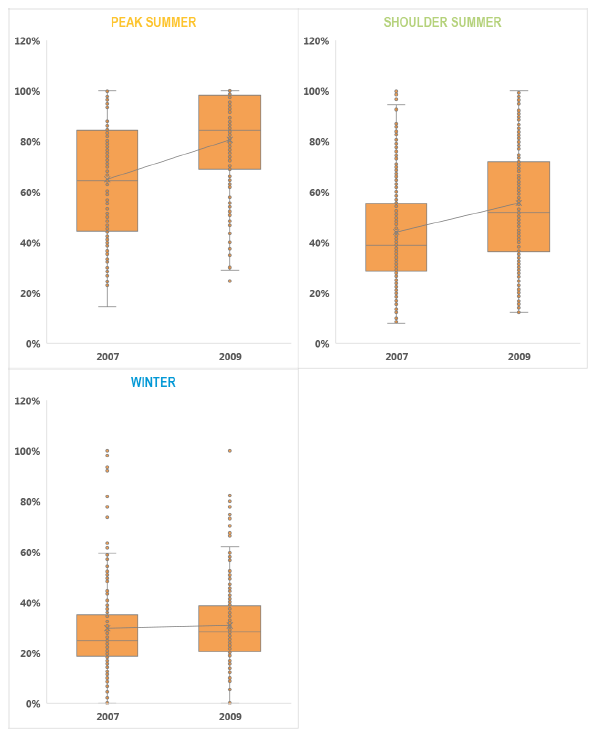
- The Uig – Tarbert route is very lightly used in winter and, even with the introduction of RET, capacity utilisation changed very little.
- In contrast, shoulder and peak summer utilisation increased substantially. Indeed, the increase in peak summer demand meant that most sailings were very highly utilised, to the extent that they were full or nearly full.
- The Uig – Tarbert route carries very few CVs and this increase in demand is therefore almost wholly attributable to the increase in visitor numbers to Harris.
Berneray – Leverburgh box and whisker chart
Figure 4.33: Berneray – Leverburgh box and whisker chart
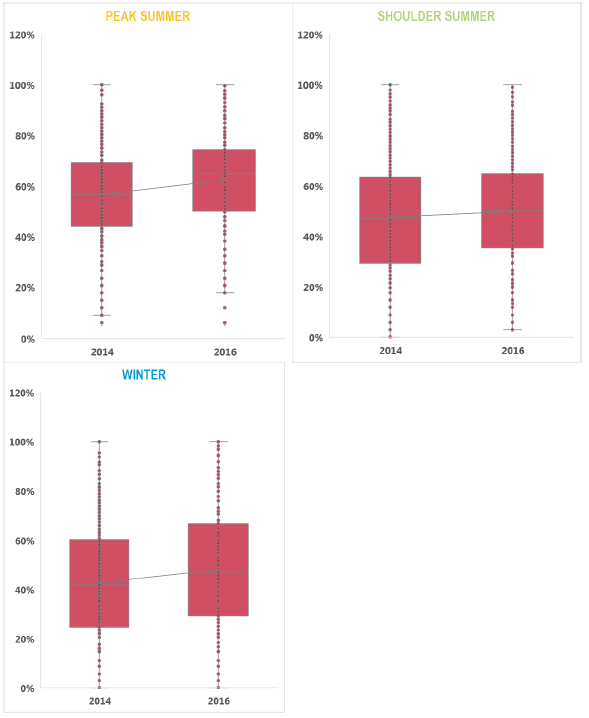
- The introduction of RET on the Sound of Harris route has also increased utilisation across all periods.
- However, unlike the other routes, there was no dominant season in terms of growth. This is because the timetable is progressively scaled back in the shoulder summer and winter period to reflect the hours of daylight restrictions on the route. Whilst the absolute increase in demand was greatest during the peak summer, this is also when the service operates most frequently.
- Whilst there are some sailings which are near to or fully utilised, there is generally capacity available across the day.
Peak summer Saturday
Figure 4.34: Peak Summer Saturday box and whisker chart
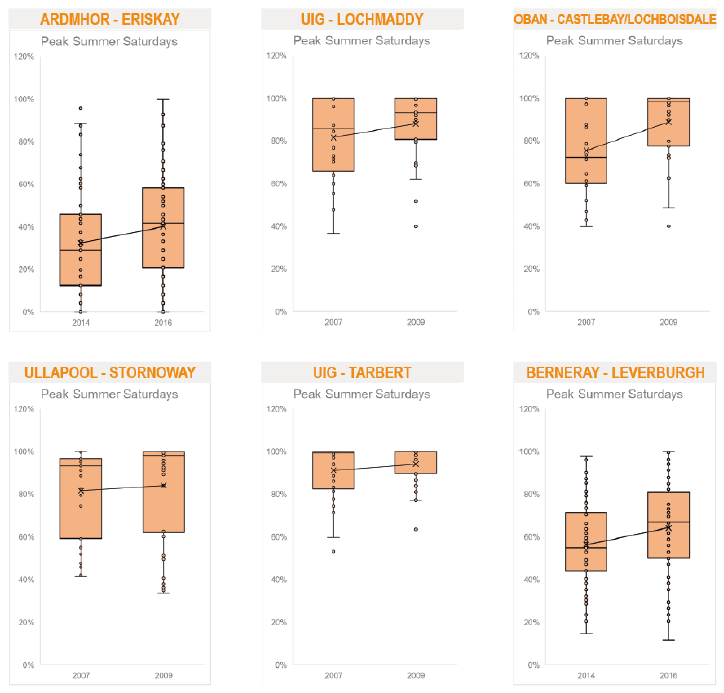
- On the Outer Hebrides network, Peak Summer Saturday sailings witnessed increases in median load factors across all routes.
- The Oban Castlebay/Lochboisdale route witnessed an increase in median load factor from 72% to 98%, whilst Berneray Leverburgh expressed an increase in load factor from 55% to 67%.
How might this have affected punctuality?
The table below presents all punctuality statistics for the CHFS network. It is not possible to solely and empirically attribute all of the changes in punctuality to RET, with other factors such as weather, vessel deployment etc also impacting. It should though be noted that, in most cases, the introduction of RET has been the one material change between the “RET Year-1” and RET Year+1” and thus at least a proportion of the punctuality change can be attributed to the policy. “Lateness” is defined as follows:
- “Level 1 Lateness” is defined as arriving between 5 and 10 minutes after the published arrival time on routes with a crossing time of up to 30 minutes or arriving between 10 and 20 minutes after the published arrival time on routes with a crossing time of between 31 and 90 minutes or arriving between 15 and 30 minutes after the published arrival time on routes with a crossing time of more than 90 minutes.
- “Level 2 Lateness” is defined as arriving in excess of 10 minutes after the published arrival time on routes with a crossing time of up to 30 minutes or arriving in excess of 20 minutes after the published arrival time on routes with a crossing time of between 31 and 90 minutes or arriving in excess of 30 minutes after the published arrival time on routes with a crossing time of more than 90 minutes.
The numbers in the table indicate the number of times the vessel was late and the distance is in statute miles.
| RET Year-1 | RET Year+1 | Year+1 – Year-1 | |||||
|---|---|---|---|---|---|---|---|
| Route | Distance | Level 1 Lateness | Level 2 Lateness | Level 1 Lateness | Level 2 Lateness | Level 1 Difference | Level 2 Difference |
| Ardrossan - Brodick | 11.8 | 116 | 54 | 280 | 164 | 164 | 110 |
| Colintraive - Rhubodach | 0.6 | 66 | 16 | 30 | 18 | -36 | 2 |
| Largs - Cumbrae | 2.4 | 138 | 86 | 156 | 130 | 18 | 44 |
| Claonaig - Lochranza | 5 | 20 | 39 | 90 | 91 | 70 | 52 |
| Tarbert LF - Portavadie | 3.4 | 60 | 48 | 247 | 149 | 187 | 101 |
| Wemyss Bay - Rothesay | 6.8 | 129 | 66 | 334 | 133 | 205 | 67 |
| Tayinloan - Gigha | 2.5 | 25 | 42 | 28 | 26 | 3 | -16 |
| Kennacraig - Islay | 32.3 | 78 | 49 | 111 | 52 | 33 | 3 |
| Oban - Colonsay | 37 | 16 | 19 | 20 | 13 | 4 | -6 |
| Tobermory - Kilchoan | 3.7 | 7 | 1 | 7 | 7 | 0 | 6 |
| Fionnphort - Iona | 1.7 | 12 | 54 | 3 | 7 | -9 | -47 |
| Oban - Coll - Tiree | 59.7 | 17 | 2 | 20 | 10 | 3 | 8 |
| Oban - Lismore | 7.5 | 2 | 4 | 0 | 8 | -2 | 4 |
| Oban - Craignure | 9.3 | 129 | 119 | 26 | 12 | -103 | -107 |
| Fishnish - Lochaline | 1.9 | 62 | 16 | 28 | 5 | -34 | -11 |
| Armadale - Mallaig | 5 | 143 | 86 | 18 | 15 | -125 | -71 |
| Sconser - Raasay | 1.9 | 2 | 6 | 1 | 2 | -1 | -4 |
| Mallaig - Small Isles | 16.6 | 28 | 9 | 15 | 8 | -13 | -1 |
| Ardmhor - Eriskay | 5.9 | 1 | 1 | 3 | 4 | 2 | 3 |
| Oban - Castlebay - Lochboisdale | 89.5 | 12 | 6 | 13 | 23 | 1 | 17 |
| Uig - Tarbert | 29.2 | 14 | 12 | 31 | 29 | 17 | 17 |
| Uig - Lochmaddy | 29.2 | 14 | 4 | 30 | 26 | 16 | 22 |
| Ullapool - Stornoway | 52.2 | 44 | 19 | 26 | 71 | -18 | 52 |
| Berneray - Leverburgh | 9.5 | 27 | 75 | 34 | 96 | 7 | 21 |
On the high-volume routes (particularly the major vessel routes), the significant increase in demand as a result of RET has in many cases extended turnaround times increasing overall “lateness”.
Note: On the Oban - Craignure route, the introduction of a two vessel service from summer 2016 offset the RET related punctuality challenges. Note this is reflected in the reduction in the level 1 and level 2 lateness in the table above, but a review of 2017 and 2018 data suggests punctuality has since worsened.
How has RET affected facilities on the ferries – ‘2015 RET’ routes?
Booking
The resident survey was aimed at the ‘2015 RET’ routes. Whist the survey contained a number of questions about booking vehicles on board the ferry, the only 2015 routes where booking is available are:
- Oban-Craignure
- Mallaig - Armadale
- Sound of Harris (Berneray – Leverburgh)
- Sound of Barra (Ardmhor – Eriskay)
The following questions are based on responses from these areas only.
Do people think it is more difficult to book on the ferry?
87% of these respondents to the resident survey said that they had found it more difficult to book a vehicle on board the ferry since RET was introduced. This aligns with the load factor data on these routes – particularly Oban – Craignure – which has increased across the year, but particularly in the summer.
When do people experience difficulty booking on the ferry?
The ‘heat map’ below shows the days of the week / months of the year when people responding to the survey experienced the most difficulty making a booking for a vehicle onboard:
Table 4.2: Bookings ‘Heat Map’ (source: residents survey n=343)
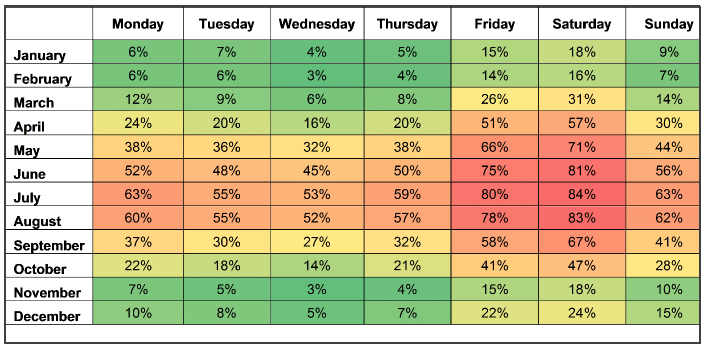
The above ‘heat map’ derived from the resident survey broadly correlates with the load factor analysis set out in the previous section. In summary:
- Summer Saturdays are reported as the most problematic for securing a booking (84% in July and 83% in August). The most frequently cited sailings with capacity issues were those which facilitated day-trips and around accommodation.
- The period of June to August on the whole reports a high incidence of frustrated bookings.
- Outside the above periods, shoulder-summer weekends are the only periods where securing a booking is identified as problematic.
Does this prevent people travelling when they wish?
Yes, 87% of resident survey responses on the three routes said that this affects their ability to travel when they wish.
What do people do when they cannot book on their preferred sailing?
The figure below highlights the course of action taken when residents cannot secure a booking on their preferred sailing:
Figure 4.35: What do you do when you cannot get a booking on your preferred sailing? (Source: Resident survey, n=343)
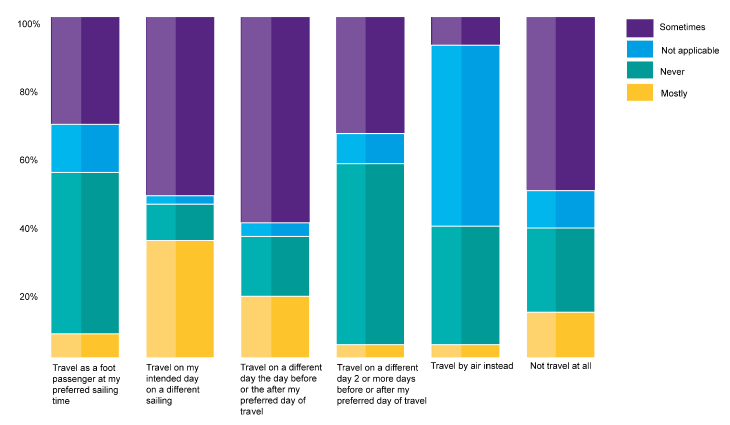
People’s main response on these routes is to travel on a different sailing on the same day. For longer, infrequent routes this would be a less readily available option. All of the above referenced courses of action are taken by a significant number of responses.
Figure 4.36: What are the consequences for people when they cannot book on their preferred sailing? (Source: Resident survey, n=343)
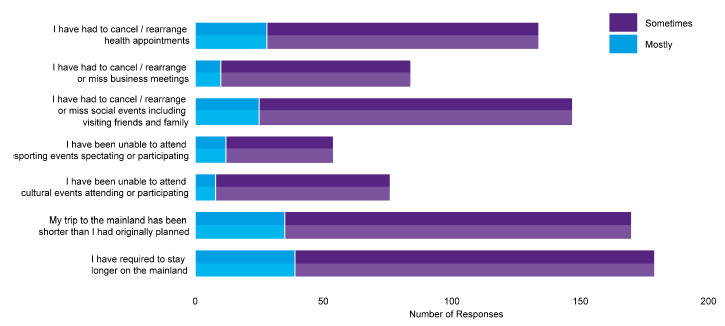
Mirroring the above, it can be seen that people incur a number of inconveniences as a result of not being able to travel when they wish. Trips are sometimes longer or shorter, and people have identified a range of appointments which are missed. This has a highly negative impact on island communities as it can create an impression of being ‘cut-off’ and or introduce a ‘hassle-factor’ when carrying out off-island activities by vehicle.
The issue around failed bookings came out strongly in the business depth interviews but has also been prominently expressed in other recent ferry-related studies which PBA has delivered, including the Outer Hebrides and Craignure STAG Appraisals.
Key point: Of the three bookable ‘2015 RET’ routes, 87% of respondents to the resident survey are now finding it more difficult to make a booking, mainly in the summer period and on summer Saturdays in particular. This is having a negative impact on island communities, either adding a ‘hassle-factor’ to trips which are being made or preventing the trip from being made at all.
Do people now book their travel earlier?
People were asked about their booking habits before and after RET, the responses to which are summarised in the figure below:
Figure 4.37: Do people now book travel earlier? (Source: Resident survey, n=260)
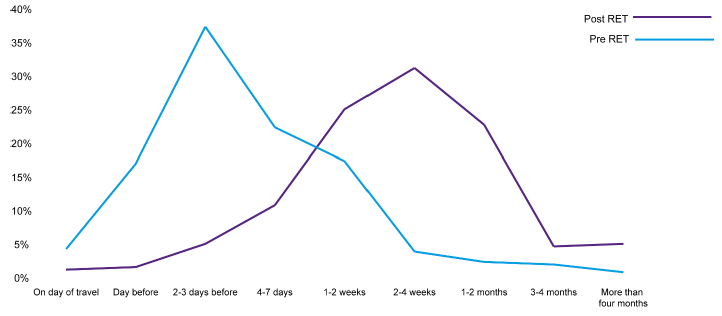
The figure above shows that the booking window on these routes has moved demonstrably according to the resident survey. The main booking period has moved from 2-3 days before to 2-4 weeks before. It is highly likely that this trend is repeated on high volume routes across the isles.
The issue of being unable to get a short notice vehicle booking has come up frequently on various recent studies around the islands.
What about non-bookable routes?
A number of respondents who live on islands with non-bookable routes made comments about queueing at peak times of year, noting that it makes journey planning difficult and leads to unreliable journey times. This problem has been particularly strongly expressed in Cumbrae, where responses to open questions in the survey highlighted the need to queue for long periods on peak summer days. CFL’s response to the stakeholder consultation highlighted a similar issue at Largs on the other side of the crossing.
Key point: On the evidence of the resident survey, the booking window has demonstrably moved since RET was introduced – prior to RET, people tended to book 2-3 days in advance but now typically book 2-4 weeks in advance. On higher volume non-bookable routes, queues are reported at the ferry terminals on peak days.
What are people’s views on potential demand management measures?
The issue of vehicle-deck capacity constraints at peak times, and the difficulties encountered by island residents in making urgent journeys at short notice, has been a recurring source of dissatisfaction identified in this and other recent ferry studies. To this end, the onboard survey explored attitudes towards a range of potential demand management measures on the 2015 RET routes. The figure below shows the net support (i.e. total agreeing minus total disagreeing) for each potential demand management measure.
Figure 4.38: Views on potential demand management measures (Source: onboard survey)
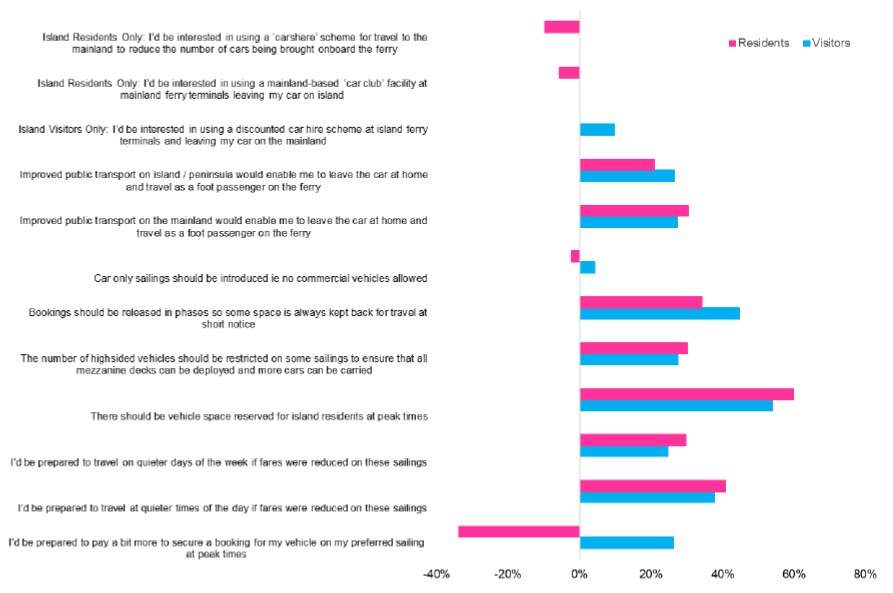
The key points of note from the above figure are as follows:
- residents and visitors provided similar answers, the key exception being that:
- on balance, residents are not prepared to pay more at peak times
- …but visitors are
- there is strong agreement that:
- space should be reserved for residents at peak times, even amongst visitors
- bookings should be released in phases
- people would switch to quieter sailings with reduced fares
- whilst more people disagreed, around a quarter of island residents agreed that they would be interested in car-share or car-club schemes
- similarly, 37% of visitors expressed an interest in using an island-based car hire scheme
Key point: The onboard surveys suggest that island residents are not willing to pay more to travel at peak times, but visitors are.
Key point: There is strong agreement amongst visitors and residents that: vehicle-deck space should be reserved for residents at peak times; bookings should be released in phases; and that people would switch to quieter sailings with reduced fares. There was also minority interest (circa 25% of island residents) in car-share and car-club schemes, whilst 37% of visitors expressed an interest in an island-based car hire scheme.
Do people think that the level of service onboard the ferries has deteriorated with RET?
The carryings and survey data clearly highlight that the ferry services are now busier, particularly in the shoulder and peak summer periods. The resident and onboard surveys explored how this is impacting perceptions of service onboard the vessels, the first figure below being from the resident survey and setting out whether respondents think the level of onboard service has deteriorated:
Figure 4.39: Perceptions of onboard service since RET was introduced (Source: Resident survey, n=437)
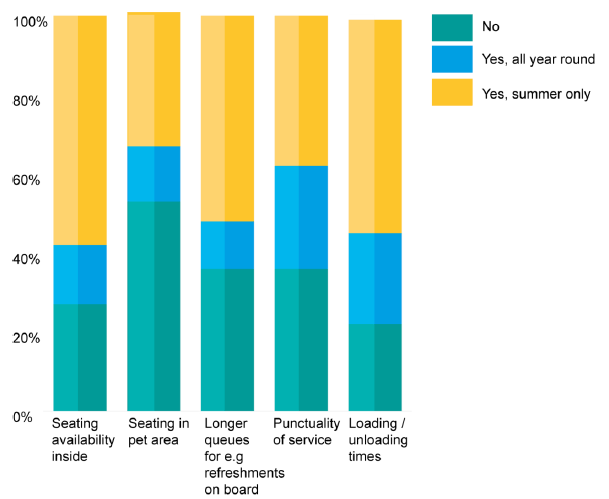
The above figure suggests that island residents think that the level of service onboard has reduced due to the additional trips being made as a result of RET. In particular, these people think that the related factors of punctuality and loading / unloading times have deteriorated, a point which is borne out by the data on several high volume ‘2015 RET’ routes, including Oban – Craignure and Mallaig – Armadale (although the current vessel deployment is more of an issue on the latter route).
In the onboard survey, those who had experience of using the ferries before 2015 were asked if they had noticed any deterioration in the level of service onboard with respect to these same aspects of the ferry service.
Figure 4.40: Perceptions of onboard service since RET was introduced (Source: Onboard survey, n=578)
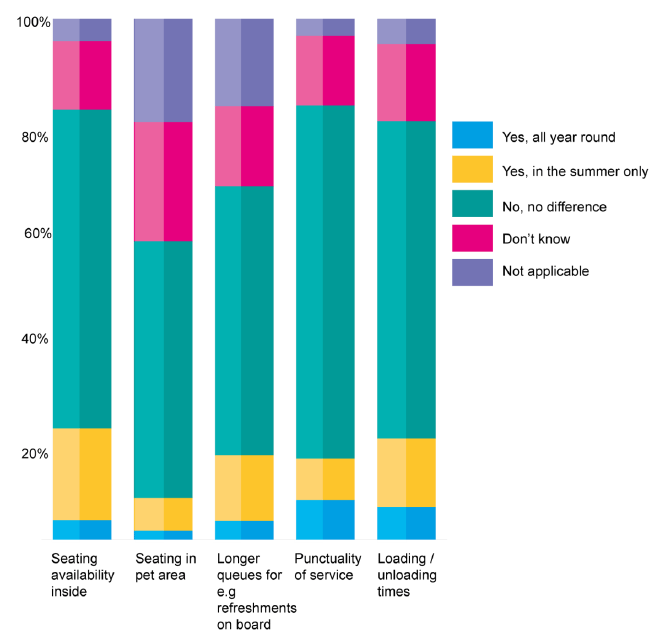
The results from the onboard survey suggest that fewer people think that the level of service has declined compared to the resident survey. A higher proportion of residents have reported a deterioration in the level of service than visitors however, which would narrow the gap between the two sets of results.
It should be noted that the operator has recruited circa 30-35 full-time equivalent (FTE) crew and 33 port staff to accommodate the increase in demand (this is explored in more detail later in the report). Without this positive response to the RET-induced demand, perceptions of the service may have been much worse.
Key point: Island residents and, to a lesser extent visitors, have noted some deterioration in the level of service since RET was introduced on the ‘2015 routes’. This is predominantly due to delays associated with slower turnaround times as a result of the increased volumes of vehicular traffic on most routes (a point borne out by operator performance data). CFL has proactively addressed this challenge by recruiting additional vessel and port staff to accommodate growing demand.
What are the consequences of these new journeys for the island economy – ‘2015 RET’ islands?
The increase in demand for ferry travel implies that those making these additional trips derive a ‘utility’ – or benefit – from doing so. This section explores the consequences of these new journeys for the ‘2015 RET’ island economies, both from a resident & visitor and business perspective.
Residents & Visitors
How have people benefitted from making these new trips?
The figure below sets out how residents of the ‘2015 RET’ islands think they benefit from making additional ferry trips:
Figure 4.41: How do island residents benefit from making additional ferry trips? (Source: Resident survey, n=367, multiple response question)

The way in which people benefit from making these new trips is closely linked to the purpose. People benefit across a range of areas, including social, leisure, shopping and healthcare.
A small number of respondents said that they have been able to access a better job, new education / training opportunities and new business opportunities meaning that the benefits of these new trips are economic as well as social.
As well as making new trips, do people take the car more often?
Yes, around 80% of those who said that they made additional trips also make more trips by car.
Are people travelling to different places when they take a car on board?
Yes, 20% of respondents have changed where they travel to when they now travel by car.
How have people benefited from going to these new places?
People switching to car-based travel see a range of benefits from doing so, as set out in the figure below:
Figure 4.42: How have people benefitted from going to different destinations? (Source: Resident survey, n=71, multiple response question)

Travelling by car rather than as a foot passenger therefore allows people to:
- access shopping opportunities
- visit friends and family more often
- access a wider range of social / leisure opportunities
How have these people benefitted from travelling by car more often?
People were asked whether they enjoyed other benefits as a result of switching to car travel, the results of which are shown in the figure below:
Figure 4.43: How have people benefitted from now taking a car on the ferry? (Source: Resident survey, n=133, multiple response question)
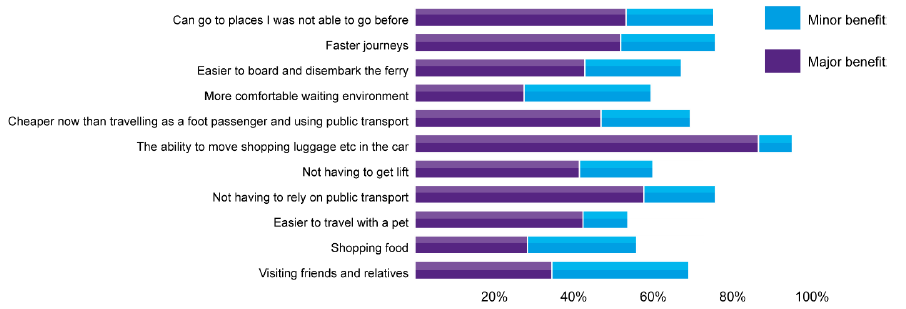
The major benefits which people perceive are:
- easier to move shopping / luggage etc
- not having to rely on public transport
- going to new places which were previously out of reach using public transport
- faster journeys
Key point: The benefits ‘2015 RET’ residents have derived from making additional trips are closely related to their journey purpose (predominantly visiting friends & relatives more often, shopping and leisure opportunities). Around a quarter of respondents make the same number of trips as prior to RET but now take a car, which has allowed them to access different destinations and widen the range of activities in which they engage whilst on the mainland.
RET has also facilitated improved access to employment, training and business opportunities for a small number of island residents, generating economic benefits for the communities concerned, which are in addition to the social benefits outlined above.
Has this increased use of the car affected the number of cars being left on the mainland, or household car ownership?
It is common in many smaller islands for residents to maintain an old on-island car (or not have an island car) and keep their primary car on the mainland. This reduces the need to pay a ferry car fare when making a journey. The survey therefore explored the extent of this effect - the evidence suggests that there has been a reduction in cars being left on the mainland:
- 11% still leave a car on the mainland
- 66% have never done this
- 23% no longer leave a car on the mainland
However, evidence from the resident survey did not suggest any significant change in car ownership levels since the introduction of RET. This suggests that residents of smaller island communities are taking advantage of lower fares to take their car back to the island more often, which aligns with the carryings figures.
Key point: The number of island cars parked on the mainland should have reduced, but no significant impact on car ownership levels was identified, which suggests that residents of the smaller island communities are taking advantage of lower fares to take their car back to the island more often.
Has this extra car use affected people’s use of public transport?
Yes, around half of these people said they used public transport less as a result of making extra car trips. This ties in with the perceived benefits of taking a car onboard and the clear trend in the data for previous foot passengers now taking a car onboard the ferry.
Are people who make extra trips now spending more on fares overall?
Whilst RET has led to a reduction in fares, the resident survey found that:
- 47% of those who make more trips by car spend more on fares
- 71% of those who make more trips overall (many of which by car) said that they now spent more on fares overall
This implies that the perceived benefits of taking a car onboard the ferry outweigh the marginal fares cost and that pre-RET fares acted as a barrier to journeys which people were wanting to make.
Key point: Due to the switch from foot passenger to car travel, a significant proportion of residents surveyed now spend more on fares than they did prior to the introduction of RET. This suggests that the perceived benefits of taking a car onboard the ferry outweigh the marginal fares costs, and that the pre-RET fares were frustrating journeys which people were wanting to make.
Do people visit, or provide services to island residents more often?
The figure below shows the extent to which RET has improved service provision to island residents and / or increased the number of visits from friends and family:
Figure 4.44: Do people visit, or provide services to island residents more often? (Source: Resident survey, n=477)
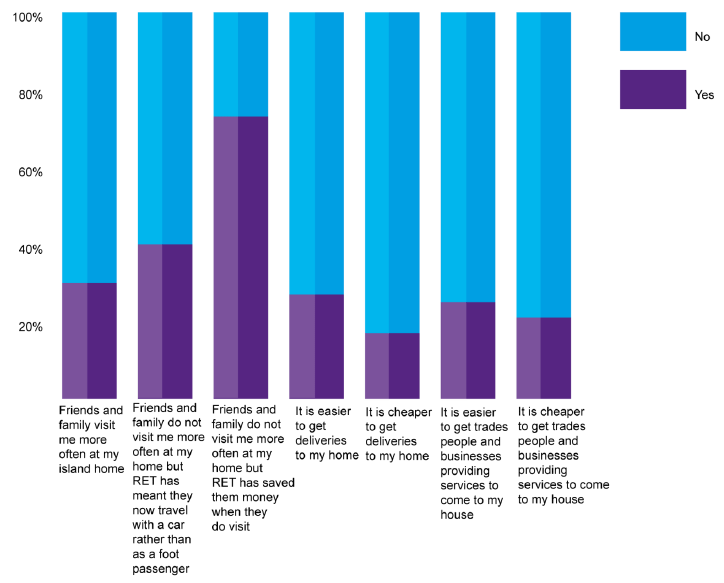
The figure suggests that around a quarter of residents in ‘2015 RET’ islands now think it is easier / cheaper for mainland- based businesses to provide services to island residents. This is clearly beneficial to island residents as it offers:
- the ability to buy / procure goods and services which they could perhaps not before
- wider choice
- potentially lower prices for goods and services
- it may be negative from the perspective of the island economy if mainland businesses and suppliers can undercut their island counterparts (this issue is explored in more detail in the ‘Business’ section below)
30% said that cheaper fares has enabled friends and family to visit more often. This is essential in an island context where the Visiting Friends & Relatives (VFR) market includes children returning from higher education or work and the island diaspora returning, sometimes for longer-periods and on occasions to assist in a family business (e.g. lambing season, harvest etc).
Key point: RET has facilitated growth in the crucial ‘visiting friends & relatives’ market, whilst also making it easier for island residents to access mainland goods and services.
Do island residents spend more on the mainland as a result of RET?
Respondents were asked whether, as a result of RET, their level of spending on the mainland and on island had changed – the responses are summarised in the matrix below:
| Island Spend | |||||
|---|---|---|---|---|---|
| Less | Same | More | Total | ||
| Mainland Spend | |||||
| Less | 2% | 2% | 1% | 5% | |
| Same | 1% | 57% | 6% | 65% | |
| More | 4% | 15% | 11% | 30% | |
| Total | 7% | 74% | 18% | 100% | |
The above matrix suggests that:
- for most people, 57%, there has been no change in their spending patterns
- 30% said that they now spend more on the mainland, but only 4% had increased spending on the mainland whilst reducing spending on island
- 18% had increased spending on island, whilst 7% had reduced island spending
- 37% said that the spending had increased in general, which presumably is the re-spending of money which would previously have been spent on ferry fares
This implies that the money saved on ferry fares has been recycled into both the island and mainland economies. On balance, more people have however increased spending on the mainland.
Key point: The evidence from the ‘2015 RET’ islands resident survey suggests that the money saved on ferry fares has been recycled back into both the island and mainland economies (and is in effect a transfer from government). 37% noted that spending has increased in general, albeit a larger proportion of this has been spent on the mainland than on the island. From the perspective of resident spending, RET has generated a net additional economic benefit for the islands concerned.
How much do visitors to the island spend?
As part of the onboard survey, people were asked how much did they spend / planned to spend on their trip with respect to accommodation and other spend. There is a clear distinction here between day-trip visitors and those spending at least one night in the island / peninsula. The results for island visitors are shown in the figure below:
Figure 4.45: Visitor spend (Source: Onboard survey)
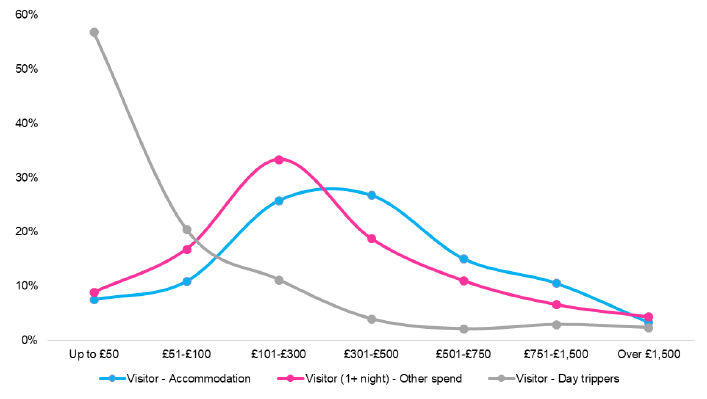
Average spend per visitor travelling party[5] (assuming the mid points of these ranges):
- visitors 1+ night, accommodation: £446 (n=639)
- visitors 1+ night, other spend: £387 (n=707)
- day trippers: £114 (n=375)
This is reinforced by the household incomes people indicated in the survey. Whilst only 18% of permanent island residents said they had a household income of more than £50,000, the figure for second homeowners was 35%, whilst for visitors it was 43%. The survey responses suggest that a small number of visitors – including daytrippers – are spending significant sums of money on-island, perhaps on one or a small number of big purchases.
Key point: The visitor spend data collected through the onboard survey suggest that visitors are spending fairly substantial sums of money on the islands. The sample suggests that tourist to the islands are disproportionately drawn from higher income groups.
Business Views
Having established how the introduction of RET has influenced consumer behaviour, the study then explored how lower fares have impacted on island businesses through a combination of the business survey and depth interviews. Since RET has primarily affected the cost of moving people rather than goods, the direct impact has been focussed on the following sectors (note that changes to supply-chain arrangements are considered in Chapter 5):
- tourism – reflecting increased visitor numbers due to lower fares
- providers of goods and services to residents who may now travel to the mainland
The focus of the business survey and depth interviews was therefore very much on exploring impacts in these two sectors.
The list below provides a sectoral breakdown by NOMIS category of the 68 businesses in the ‘2015 RET islands’ which responded to the business survey.
- agriculture, forestry & fishing = 6
- manufacturing = 9
- water supply, sewerage and waste management = 2
- construction = 3
- wholesale & retail trade and repair of vehicles = 7
- transportation & storage = 5
- accommodation & food service activities = 15
- real estate activities = 3
- professional, scientific and technical activities = 1
- administrative & support service activities = 2
- public administration & defence = 2
- education = 1
- human health & social work activities = 3
- arts, entertainment & recreation = 7
- other service activities = 2
Visitor numbers
The operator data clearly highlighted the network-wide growth in carryings, much of which was driven by an increase in visitor numbers to the islands. This is true also of the ‘2015 islands’ where the introduction of RET led to reductions in fares to some of the most popular tourist destinations (e.g. Bute and Cumbrae) and others where fares may previously have acted as a deterrent to using the ferry (e.g. Mull).
Of the 48 businesses which were established in their respective island communities prior to 2015 and responded to the question on visitor numbers, there was consensus that visitor numbers had increased. Interestingly, all 48 businesses identified an increase in the number of day-trippers - whilst this was dominated by Cumbrae (13) and Mull & Iona (15), there was a spread of positive responses across all islands, including the Outer Hebrides, where RET on the Sound routes has encouraged increased visitor movements between the islands in the chain.
Around two thirds of businesses identified an increase in short-stay holidays (1-4 nights), a quarter of which were based in Mull, with a more even spread across the other islands. A further 21 noticed an increase in long-stay (4+ nights), with a reasonable spread of responses across the islands.
The findings of the business survey were largely borne out by the depth interviews, where there was a view from a range of islands including Cumbrae, Mull, Raasay and Skye that overall visitor numbers have increased. Key points of note / context emerging from the business interviews include:
- There was widespread support for the business survey finding that visitor numbers have grown on most islands. Unsurprisingly, this outcome is particularly pronounced in the islands which are closest to the mainland and where there is a well-defined tourism product. There was also a general consensus that the length of the visitor season has now extended to cover the whole summer timetable, a point borne out by the carryings data where there has been strong shoulder-summer growth.
- There was a general view amongst businesses that growth in the daytripper market has been stronger than in the short and long-stay market. This is unsurprising given that, in volume terms, the ‘2015 RET’ islands are dominated by Bute, Cumbrae and Mull which historically have a strong daytripper market (particularly Bute and Cumbrae)
- There was also a widely held view (supported by the carryings data) that the growth in car traffic has exceeded the overall growth in visitor numbers (the implications of this point are explored later in this section)
- The business interviews also identified a strong growth in ‘secondary tourism’, whereby islands are benefitting from discretionary and unplanned visits from neighbouring areas. This was particularly the case in Raasay which is to some extent benefitting from the Skye market and in the Outer Hebrides, where RET on the Sound routes has facilitated day- trips along the chain, and in particular between Harris & North Uist (and vice versa)
- Whilst RET has facilitated growth in visitor numbers and reduced the psychological barrier associated with high absolute fares, several stakeholders were at pains to point out that such growth cannot be solely attributed to RET. New attractions, promotion and marketing and the weakness of Sterling are all considered to have contributed to this growth
Key point: There was strong agreement across the ‘2015 islands’ that RET has facilitated increased visitor numbers to the islands, particularly in the daytripper market.
Visitor expenditure
Whilst there was consensus that overall visitor numbers have grown in the ‘2015 islands’, views were much more mixed in terms of the level of expenditure by visitors to the islands. Of 48 businesses established in the islands prior to 2015, only 20 responded that they had witnessed a growth in visitor spending, a finding that is slightly at odds with the onboard surveys.
Whilst a relatively small sample, the message from the survey suggests that, in islands where the increase was dominated by day-trippers, the increase in on-island spend was less noticeable, with expenditure largely concentrated in food-based retail. Indeed, it is notable that in Cumbrae and Mull, the number of businesses responding that expenditure had not increased was greater by a factor of two than those which had recorded an increase – this is despite those islands recording the highest recognition of the growth in overall visitor numbers.
The business survey findings were borne out by the stakeholder interviews. One further point made through the interviews is that, post-RET, the comparatively low cost of taking a car means that it is easier and cheaper to buy goods on the mainland and take them over on the car than to buy them on-island. This point applied both to daytrippers and longer-stay visitors.
Key point: A growth in visitor expenditure has been identified through the business survey and stakeholder interviews. However, this is by no means universal and has been largely focused in food- based retail. It was also suggested that the comparatively low cost of taking a car since RET was introduced has prompted visitors to buy goods on the mainland and take them over in the car rather than travelling as a foot passenger and buying on-island.
Competition & economic leakage
From the perspective of island-businesses, reductions in fares are of course a potential two-way street – whilst they make it easier for people to visit the isles, they also make it easier for island residents and businesses to make use of mainland retail opportunities and services. This trend was indeed identified through the resident survey.
The business survey asked whether businesses in the 2015 islands had experienced increased competition as a result of the introduction of RET. Of the 42 businesses which responded, just under a quarter noted that they have experienced additional competition, although around 70% noted that they had not. Two thirds of the businesses which noted that they did experience additional competition were located in Cumbrae and Mull.
Whilst a minority of businesses noted that they are now subject to more competition as a result of RET, half the businesses surveyed (n=21) responded that island residents are now spending more on the mainland, a finding which is consistent with the resident survey (albeit that survey also suggests that island-based spending has also increased). There is again a clear trend here of businesses on islands close to the mainland being the most heavily affected – 18 of the 21 businesses identified were located in Cumbrae (9), Mull (7) and Bute (2).
The position with regards to island residents sourcing more goods from the mainland was more ambiguous, with 13 of 42 businesses responding that they had noticed this effect. 12 businesses had noticed no difference, with 17 responding that they did not know (which is unsurprising given that this question only applies to service-related businesses). However, it was again apparent that the islands most affected by RET in this respect were those closest to the mainland, with 11 out of the 13 businesses located on Bute, Cumbrae or Mull.
Key point: Overall, the introduction of RET to the ‘2015 islands’ has had a differential effect in terms of exposing the islands to increased competition and economic leakage from residents buying goods or services on the Scottish mainland. The business survey and accompanying interviews have highlighted that the islands closest to the Scottish mainland and with a reasonable scale of on-island retail and service provision have been most affected (i.e. Bute, Cumbrae and Mull). Other islands which are more distant (e.g. the Small Isles) or which have always had a dependence on the mainland for retail and service provision (i.e. Lismore) have been more insulated against this effect.
Reverting back to the original question, there is a wider debate as to whether increased competition, in its broadest sense, is a good thing for island economies. On the positive side:
- The cost of goods and services across the islands is often higher than for comparable areas on the mainland, which can in part be attributed to the cost imposed by needing to use a ferry and the captive on-island market. Reductions in the cost of ferry travel offer an opportunity to buy some goods at a lower cost on the mainland and may also facilitate market entry (particularly for services), reducing prices if the competitive effect is strong enough. This in turn would increase the disposable income of island residents and can thus be considered a benefit.
- Secondly, whilst island residents choosing to spend more money off-island may be considered a negative, they are making this choice because they derive a benefit from doing so. This again can be considered as a benefit in terms of increasing disposable income (financial benefit) and / or providing greater choice (utility / social welfare benefit).
On the negative side:
- Island residents choosing to spend more money on the mainland or on services supplied from the mainland represents ‘leakage’ from the island. A reduction in on-island spending will of course impact on the profitability and viability of island businesses, with ‘multiplier effects’ likely to be more significant in a smaller community because of the dependence on locally generated demand.
- Moreover, many island businesses have multiple roles – for example, the island shop may contain the local tourist information office or post office. If the viability of such businesses is compromised, the impacts will be more widespread than if say a shop or petrol station in an urban area closed down.
Business turnover and employee numbers
As a proxy for the impact of RET on business finances, respondents to the business survey were asked how their turnover had changed since fares were reduced in October 2015. Of the 46 businesses who were established in the ‘2015 RET islands’ before the policy was introduced:
- 17 businesses noted that their turnover had increased - around one third of these businesses noted that RET was a contributing factor in the change to their turnover.
- However, the same number noted that their turnover was unchanged, with a further eight businesses responding that their turnover had declined.
Businesses which noted that their turnover had increased were fairly evenly spread across the ‘2015 RET’ islands. However, it is very notable that over half of the businesses where turnover went down are located in Cumbrae, with three of the other four in islands proximate to the mainland (two in Mull, one in Bute). Whilst the sample is relatively small, the businesses which have identified a reduction in turnover predominantly provide goods and services to local residents and have a degree of exposure to external competition (an issue revisited later in this section).
Whilst turnover has on the whole increased, this has not generally fed through to increased employment. 43 businesses answered this question, with only six responding that employment had increased, of which only four identified RET as a factor in this expansion. This is likely to be in part due to the majority of respondents being small businesses, and in many cases, family businesses.
Key point: Whilst around 40% of businesses noted that turnover has increased since RET was introduced in 2015, competition has also eroded turnover for around a fifth of businesses surveyed, with these businesses concentrated on islands close to the mainland. The increase in turnover has not particularly fed through to a growth in employment.
What are the consequences of these new journeys for the Scottish economy – ‘RET 2015’ islands?
As part of this study, we explored whether it was possible to undertake an economic impact assessment (EIA), establishing a quantitative estimate of the impact of the policy on Gross Value Added (GVA) and employment – i.e. quantifying the benefits column of the ‘RET ledger’. The survey and carryings data provide material which could feed into an EIA but, in our judgement, there are simply too many unknowns for a credible and robust estimate of the impact of the policy to be made. To this end, a largely qualitative description of the impact of RET at the Scotland level is set out below.
At its simplest level, the introduction of RET has had two impacts:
- For any ferry trip which would have taken place without the introduction of RET, the reduction in fares would be reflected in an increase in the disposable income of the user. Whilst this is simply a ‘transfer’ from government to user, if that disposable income is then spent, it will generate multiplier effects in terms of employment and economic output (typically defined as Gross Value Added, or GVA).
- Where RET has generated a new ferry trip, it may give rise to additional economic impacts associated with increased expenditure on the island or adjacent areas of the mainland, which would again feed through into an increase in local output and employment.
Journeys which would have taken place with or without RET
For journeys which would have taken place regardless of whether RET was introduced or otherwise (circa 94% of the onboard survey sample), the primary benefit of RET is an increase in disposable income afforded by the reduction in fares. These impacts would be manifested in the following way:
- A proportion of the savings made by both island residents and visitors will be reinvested on the island or adjacent mainland areas. Indeed, the resident survey suggests that 37% of respondents have increased spending, which is presumably re-spending the money saved on fares. As well as providing a transfer to what are in many cases economically fragile areas, the increased local spending will have employment and income ‘multiplier effects’, meaning that each £1 invested by the Scottish Government will in theory have a higher value return.
- The one caveat to the above point is that there will be an element of ‘leakage’ associated with:
- island residents re-spending this money outwith Scotland (e.g. online)
- Scottish visitors re-spending this money outwith Scotland
- non-Scottish visitors saving a proportion of the money and returning to their home country with it
- There may also be an element of ‘displacement’, but this will principally be local in nature, reflecting a change in the balance of island / mainland spending. There is therefore likely to be little, if any, impact at the national level
- Average wages in Argyll & Bute, the Outer Hebrides and the Highlands lag the Scottish average, whilst the cost of most goods and services in island communities is typically higher than on the Scottish mainland. From a socio-economic perspective, the ‘RET investment’ assists in narrowing this differential, effectively providing an indirect transfer payment from government supporting island residents.
Key point: The introduction of RET has increased the disposable income of island residents and visitors. Whilst there will be a degree of economic leakage, the policy nonetheless represents an investment in island communities, supporting both GVA and employment growth.
Journeys generated by RET
The onboard survey suggests that around 6% of journeys were generated by RET, with a further 5% of trips now being made by car when they were previously foot passenger only. The ‘generated trips’ imply a direct economic benefit as people are now making journeys which the level of fares previously stopped them from doing. There are a range of national economic impacts associated with this:
- The increase in visitors to the islands directly attributable to RET represents a net additional economic benefit at the Scotland-level, assuming these journeys are not simply displaced from elsewhere in Scotland.
- From a productivity perspective, the resident & business surveys and business interviews suggest that RET has facilitated increased business travel, business-to-business interaction, business formation and competition. These effects combine to improve the productivity of the islands and nearby mainland areas, and thus Scotland as a whole.
- From a labour market perspective, the resident survey suggests that RET has facilitated improved access to employment – i.e. better connecting the labour market to the jobs market. The additional employment-related journeys may be a combination of connecting those out of work to employment or facilitating a move to more productive employment. This will have the effect of expanding the size of the island / nearby mainland economy and thus the Scottish economy overall.
- From a social perspective, RET has facilitated a range of journeys which are socially desirable – e.g. it has expanded access to education, allowed for visiting friends & relatives more often (and vice versa) etc. Whilst such benefits are difficult to quantify, they are integral to the sustainability of island communities, a key policy objective of the Scottish Government.
Key point: The new journeys generated by RET have supported an increase in Scottish visitor numbers, national productivity and labour market flexibility. These effects combine to provide a net economic benefit at the national level.
Whilst RET has generated a range of benefits at the national level, it is though important to caveat that there is an opportunity cost attached to the policy in terms of where else that money could have been invested.
What has been the long-term impact of RET on the islands?
Outside conventional economic impact assessment approaches, there is a much wider question as to how the lower fares introduced by RET have translated into wider social and economic impacts in the isles in terms of e.g. productivity (i.e. Gross Value Added); employment; population; investment; land-use etc.
The ability to map and evidence the long-term impacts of RET is dependent on secondary data. However, as explained in the research approach chapter, the issues of spatial definition and time lag mean that identifying appropriate data with which to make a before and after assessment is highly challenging. A review of available socio-economic data was undertaken at the outset of this study. This review confirmed that the data geography covering Scotland’s islands, and in particular the smaller islands, makes it difficult to draw out meaningful evidence on how RET or indeed other investments have impacted on the islands.
The above said, it was considered that the Outer Hebrides would provide a useful case study of the impact of RET because:
- as a contiguous landmass, local authority area and Parliamentary Constituency (both Scottish and UK), the data geography of the islands lends itself to the analysis of wider social and economic outputs outlined above
- as RET was first introduced to the Outer Hebrides in 2008 (except the Sound routes), data lag is less of an issue (although a clearer picture will be available following the 2021 Census)
However, the key point emerging from this case study is that, even where RET is long established, the type and scale of data collected simply does not facilitate the isolation and rigorous evaluation of the impacts of a major policy of this nature. For example, consistent data on visitor numbers is not regularly and systematically recorded. This is a key issue, particularly in the context of the National Islands Plan and the commitment to ‘island-proofing’ and Island Impact Assessments. A key recommendation emerging from this study is therefore to commission the regular collection of datasets which would feed into planning and evaluation of policies. Representations should also be made to more appropriately define the islands in key national datasets.
Key point: The type, volume and spatial disaggregation of data covering Scotland’s islands does not support the rigorous and robust evaluation of how RET (or indeed other major policies) has impacted on the society and economy of the isles. The absence of appropriate data is in itself an important finding and should be fed into the wider considerations around the National Islands Plan, particularly in the context of carrying out Island Impact Assessments.
How has RET impacted on the environment – ‘2015 RET’ islands?
A consistent finding across all components of this study is that RET has led to an increase in the number of people taking the car on the ferry – some of these trips are newly generated, and some of them are as a result of people switching from travelling as a foot passenger and / or on public transport. There are three negative environmental consequences in this respect:
- an increase in global emissions associated with increased vehicle kilometres – as well as more cars on the ferry, the resident survey also found that people are travelling to new destinations
- potential air quality associated with stationary traffic at the busier terminals in urban / residential areas (e.g. Largs, Oban, Mallaig, Ullapool etc)
- it should be noted that there is no quantitative evidence to suggest that any air quality issues have emerged, as such data does not exist
- a further increase in global emissions associated with the operation of any additional ferry services to cope with demand
Key point: Whilst RET has offered social and economic benefits to the island communities and those who visit them, it has had a net environmental disbenefit. This is primarily as a result of increased vehicle kilometres, increased ferry sailings and, potentially, air quality impacts in ports around urban / residential areas.
Why do people feel they need to take a car on the ferry?
Whilst RET has generated negative environmental impacts, it is important to understand why people are choosing to take their car on the ferry more often, particularly when the evidence suggests it is costing them more in fares. Indeed, 55% of the onboard survey sample had taken a car onboard the ferry, citing the following as their reasons for doing so:
Figure 4.46: Why was a car taken on the ferry? (Source: Onboard survey, n=881)
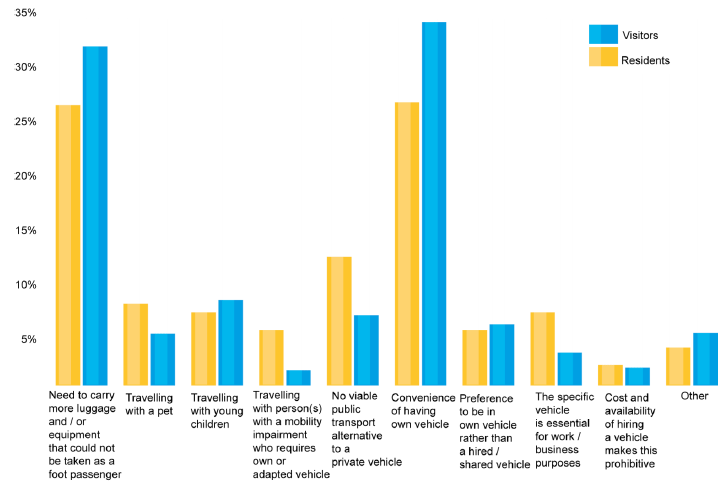
Both visitors and residents cite similar reasons for needing to take a car onboard, these mainly being the need to carry luggage etc. and the convenience of using their own vehicle. By inference, the benefit associated with being able to do this outweighs the additional cost in fares.
Could these people have used public transport instead?
Those taking a car onboard were asked if they could have used public transport for their mainland and island leg of their trip in turn. The answers were similar for both so are shown combined below.
Figure 4.47: Could these people have used public transport instead? (Source: Onboard survey, n=881)
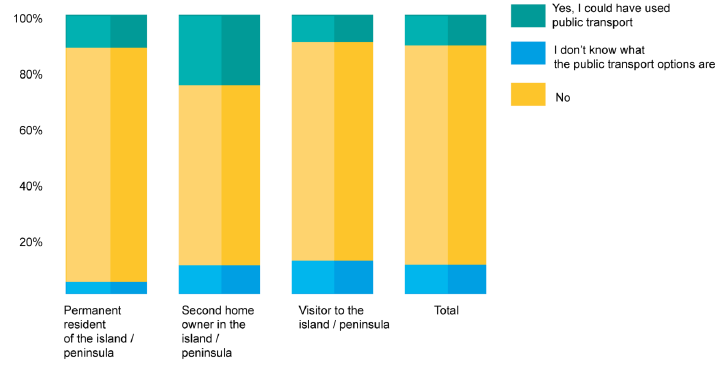
Around 10% of respondents to the onboard survey said that they could have used public transport, but nearly 80% said that public transport was not an option for them on the mainland or island. The limited public transport connections outwith the Firth of Clyde will always be a major deterrent for any ferry passenger making a journey beyond the immediate ferry landfall – this issue also came through strongly in the resident and onboard surveys undertaken in the Outer Hebrides STAG Appraisal.
Key point: Visitors and residents both highlighted their main reasons for taking a car on the ferry as needing to take luggage / equipment and the convenience of having their own vehicle. This suggests that the absolute level of fares prior to the introduction of RET acted as a deterrent to travel. 80% of car users noted that public transport was not an option for their onward journey, a particular issue outwith the Firth of Clyde where rail and bus services are infrequent and journey times long.
Why do people who could use public transport not use it?
Of the 10% or so of respondents who noted that they could have used public transport for their journey, they were asked why they did not do so. The responses to this question are set out in the figure below:
Figure 4.48: Why did the respondent not use public transport? (Onboard survey, n=76)
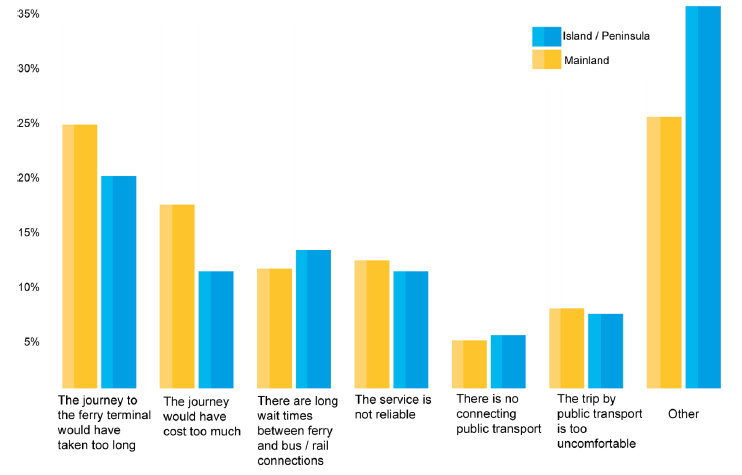
Key point: The reasons for not using public transport were similar for the mainland and island legs of the journey. The journey times, interchange times and cost of public transport are the main deterrents to its use for connecting with ferry services at either side of the crossing.
Key point: Whilst it can be argued that RET has had negative environmental implications, the journeys which are now being undertaken by car which were not before are of personal benefit to the individuals concerned, who are now making journeys which were previously frustrated by the cost of travel. The survey suggests that the scope for growing mode share in these two areas is limited given long onward journey times, limited public transport coverage etc.