Literature review
Introduction
This introductory section is intended to summarise the background principles of friction, including rolling resistance, and some of the commonly used terms associated with the subject.
Friction
Friction is the resistance to motion of one object moving relative to another. Scientists believe it is the result of the electromagnetic attraction between charged particles in two touching surfaces. There are two main types of friction: static and kinetic. The former operates between two surfaces that aren't moving relative to each other and is the force that keeps a box on an incline from sliding to the bottom. Kinetic friction can be broken down into two types: sliding and rolling friction.
In terms of tyre-pavement interactions, vehicles consume fuel in order to overcome different types of friction or resistance. Figure 2-1 shows how different types of friction are generated when a force is applied to an object at rest. Static friction has a greater value than kinetic friction as there is much more inter-molecular attraction when an object is at rest as opposed to moving. As the force is increased a point is reached, known as the limiting friction, where the object begins to move. The value of kinetic friction will depend on the area of contact between the two surfaces. It should be noted that rolling friction is much weaker than sliding or static friction. In the case of when brakes are applied to a moving vehicle, then the rolling friction ceases and sliding friction comes into play.
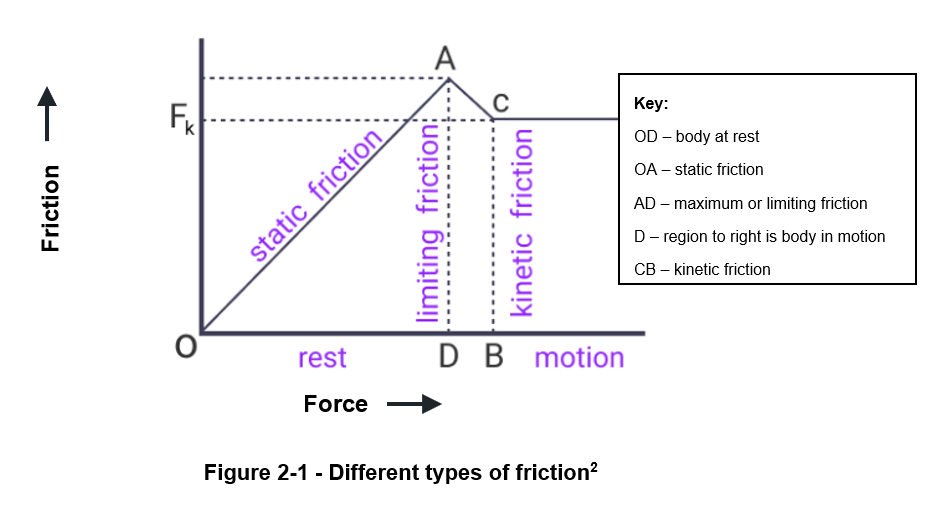
Ref: Sciencetopia (2023)
Rolling Resistance
Rolling resistance or rolling friction is the weakest type of friction. This fact was exploited by ancient Egyptians as part of making their pyramids. Rollers, which are basically a variation of a wheel, were used as a friction-reducing device to facilitate the movement of heavy objects along the ground.
Wheels reduce friction by allowing the contacting surfaces to roll rather than to drag or slide over each other. The amount of rolling friction developed is dependent on a range of factors such as the properties of the wheel, surface, vehicle load, speed, etc. The primary causes are thought to be associated with deformations of the tyre and pavement. These deformations result in energy losses that are dissipated in the form of heat during the rotation of the wheel.
Rolling resistance can be expressed by the generic equation shown in Figure 2-2.
Figure 2-2 - Rolling resistance equation
F = Cr W
Where F is the rolling resistance force, Cr is the dimensionless rolling resistance coefficient and W is the weight of the rolling body.

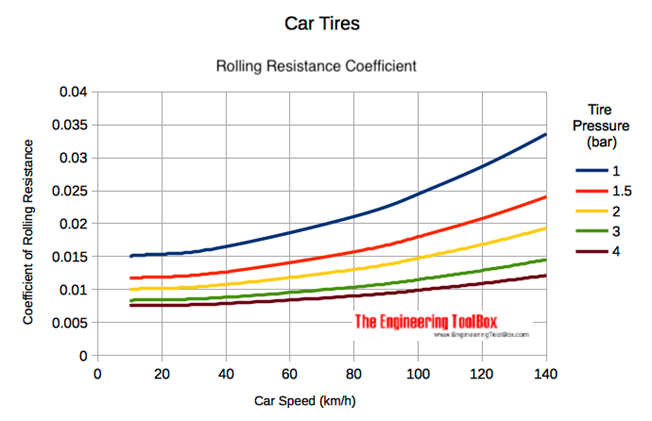
Figure 2-3 - Influence of wheel pressure & speed on rolling resistance coefficient
Courtesy of The Engineering ToolBox
Measuring rolling resistance
The Forum of European National Highway Research Laboratories (FEHRL) commenced a project on vehicle rolling resistance in 2010. The project spanned six years and was known by the acronym MIRIAM: Models for rolling resistance In Road Infrastructure Asset Management systems. The overall aim of MIRIAM was to provide information useful for achieving a sustainable and environmentally friendly road infrastructure. More specifically, the study focussed on developing models that could forecast and reduce the amount of CO2 emitted by vehicle rolling resistance in relation to pavement type and condition.
The measurement of rolling resistance is difficult and requires the use of specialist equipment that needs to be operated by skilled and experienced staff. As a result, it is only ever carried out on small parts of the road network. For road management purposes, it is not practical to base decisions on direct measurements of rolling resistance. One of the main concepts behind the MIRIAM project was to be able to predict rolling resistance from road pavement parameters that are already collected for most of the road network, such as texture, unevenness, stiffness and road topography.
The first output of the MIRIAM study was to provide knowledge on the tyre and road interaction which relates to rolling resistance, and to provide a state-of-the-art knowledge about the measurement methods and equipment. The study grouped measurement methods into four general categories:
- Laboratory drum method;
- Trailer method;
- Coast-down method; and
- Fuel consumption method.
Laboratory Drum test
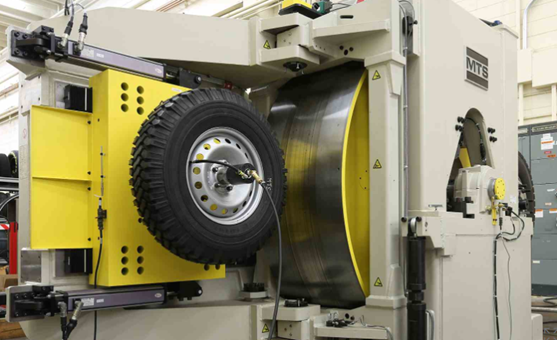
The laboratory drum test is based on an international standard (ISO 28580:2018) and specifies methods for measuring rolling resistance, under controlled laboratory conditions. The standard is for new pneumatic tyres designed primarily for use on passenger cars, trucks and buses. The method enables comparisons to be made and can therefore rate the rolling resistance of new test tyres. An advantage of this method is that it excludes various factors that influence the rolling resistance of a tyre. However, the main disadvantage is that the test surfaces do not resemble the road surface conditions that can be expected to be encountered on an actual road. An example of a laboratory drum test is shown in Figure 2-4.
Trailer Method
The trailer method is a method where rolling resistance measurements are made with a test tyre or tyres. The trailers may be designed either for passenger car tyres or for heavy truck tyres. The measurement may be made by measuring increases in torque, or the angle by which the tyre vertical support is displaced.
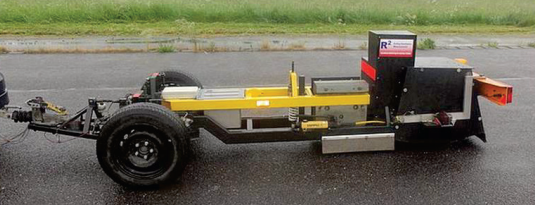
A trailer developed by the Technical University of Gdansk (TUG) participated in the MIRIAM project and was considered to show good repeatability. It is now regarded to be one of the most used trailers in Europe for measuring rolling resistance. It was used to measure the rolling resistance of test sections in a study for the Danish Road Directorate in 2018 and to evaluate the performance of low rolling resistance materials for Highways England (Low rolling resistance trial. Unpublished Report 60610780, AECOM (2020)) in 2019. The trailer shown in Figure 2-5 is configured in a way that influences from factors such as road inclination and longitudinal acceleration are eliminated.
Coast-down Method
The coast-down method is now a standardised automotive test which measures the speed profile and distance travelled while a vehicle coasts down from 75 to 5 mph. It was originally designed to estimate the aerodynamic resistance to the motion of a selected test vehicle, but was subsequently adapted to estimate rolling resistance. The coast-down method involves accelerating a vehicle to a certain speed between defined start and end points, and then to let it roll freely in neutral gear. As the vehicle slows down the speed is measured continuously along the road section. Normally, measurements are made in both directions on the road, to average out influences such as gradient and wind. Advantages of the method are that it may be performed with heavy or light vehicles and that wheel suspension losses can also be measured. The method requires careful measurement and analysis to separate the contributions of the different resistances acting on the test vehicle.
Fuel Consumption Method
An indirect way to measure rolling resistance is to measure fuel consumption and, by means of some model, estimate the rolling resistance. Typically a test vehicle would be fitted with specialist equipment to measure vehicle speed, ambient air, fuel and engine temperatures. Wind speed and direction at some point near the vehicle also needs to be measured as it could affect results. Fuel consumption methods are sensitive to driver behaviour, or the efficiency of cruise control systems, as these are potential error sources.
Measurement summary
A review of papers on measurement methods for rolling resistance suggested that they are in their infancy and still under development. Standards exist for testing tyres but they are viewed to have serious drawbacks as they do not consider the fact that rolling resistance is dependent on a tyre‑road interaction.
Pavement properties affecting rolling resistance
As stated earlier, rolling resistance is a result of an interaction between tyre and pavement and it is often difficult to separate the influences of the tyre and the pavement. In relation to what can be done in a road management context, this section reviews research that focusses on the road surface properties that affect rolling resistance. However, it should be noted briefly, that the contribution of the tyre should not be underestimated. Manufacturers of bicycle, car and truck tyres, are increasingly promoting the use of low rolling resistance tyre technology.
A recent independent study conducted for Highways England highlighted the influence of tyre selection in reducing rolling resistance. The road trial was designed to evaluate the performance of low rolling resistance asphalt mixtures and utilised the Trailer Method. The TUG trailer collected Cr measurements and showed that the biggest variations were due to changes in tyre type rather than pavement characteristics. The study drew attention to the fact that tyre selection is not currently imposed on road users and recommended that financial incentives should be considered to promote the uptake of tyres with low rolling resistance.
Surface profile – texture and unevenness
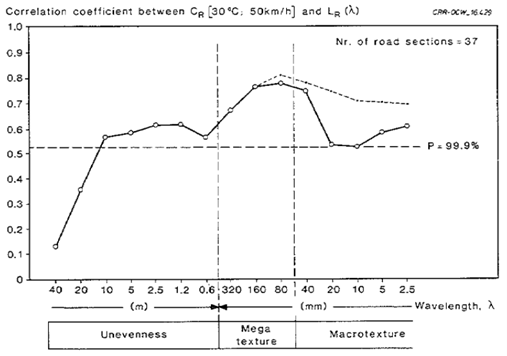
Work carried out in the 1980s by the Belgian Road Research Centre used a rolling resistance trailer and profilometer on a wide variety of surface types and conditions. The coefficient of rolling resistance (Cr) was found to be between 0.013 and 0.021. The collected data was used to analyse the relation between Cr and surface profile. The main surface-related factor that influenced Cr was surface profile irregularities in a wavelength range between macrotexture and unevenness, namely megatexture, i.e. 50 mm < wavelengths < 500 mm. Figure 2-6 is an extract from the report which shows the correlation between Cr and road roughness.
The Miriam study highlighted that megatexture was likely to have a substantial influence on rolling resistance and noted that it was not measured directly, but was represented in data sets for macrotexture, as measured by mean profile depth (MPD), and unevenness as measured by the international roughness index (IRI). The MIRIAM study stated that the influence of different wavelengths in the road surface profile were likely to be a function of:
- Tyre contact patch area or contact patch length;
- tyre type and inflation (which affect the contact area); and
- vehicle dynamic parameters, such as spring constants of tyre and springs, shock absorber damping force as a function of vertical speed, etc.
Typical tyre contact area lengths are 0.15 m for a car tyre and 0.25 m for a heavy vehicle tyre, but will change with changing tyre load and with inflation. It is likely that :
- Wavelengths shorter than the length of the contact area influence Cr by a deformation of the contact area; and
- that wavelengths longer than the contact area influence Cr by effects, such as losses in the suspension, possibly due to the vertical movement of the full vehicle.
A project titled, Energy Conservation in Road Pavement Design (ECRPD), utilised the coast-down method to perform experiments with both light and heavy vehicles. Based on the data collected, Figure 2-7 shows the relative contributions of air and vehicle rolling resistance.
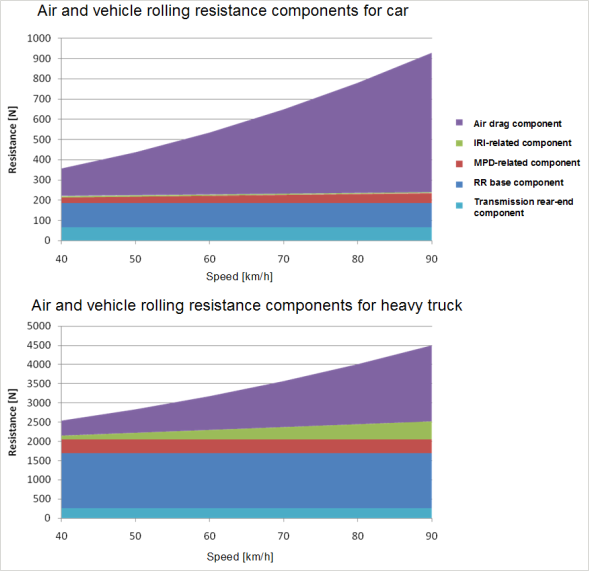
Some important observations from the figures are:
- Only the air drag and the IRI-related component - mainly shock absorber losses - appear to have a significant correlation with speed;
- air drag is very important for the car and less important for the truck, it starts to exceed vehicle rolling resistance at approximately 60 km/h for the car and higher than 90 km/h for the truck;
- IRI or road unevenness is more important for the truck and increases with speed.
Sandberg highlighted that a certain level of macrotexture is desirable as standing water causes the rolling resistance to increase, owing to energy consumed in the removal of water. High levels of macrotexture tend to reduce the amount of water and reduce the energy needed to remove the water from the tyre-road interface. The work highlights the balance that needs to be struck between providing adequate macrotexture and minimising rolling resistance.
Stiffness
According to Sandberg a wheel rolling along a pavement produces a bow-wave effect as the pavement surface in front of the wheel rises to relax the compression under the wheel. The magnitude and shape of this bow-wave is a function of vehicle weight, tyre characteristics, suspension system as well as pavement and subgrade stiffness. The deflection of the pavement under a loaded tyre, should also result in some energy consumption that contributes to rolling resistance.
Deflections in the road pavement, as well as the tyre, are subject to hysteresis losses. Hysteresis is an energy loss process associated with materials when they deform and recover under loading conditions. The energy loss is dissipated as heat. As an asphalt pavement will deflect or deform more under load than a concrete pavement it follows more energy would be lost and will increase the rolling resistance. The cement industry in the USA have made claims that concrete pavements provide less rolling resistance than asphalt pavements.
A study by TRL was carried out to determine whether pavement stiffness has a significant influence on the energy required to travel along a pavement. The study found that the average Cr for a rigid pavement was 5.6% lower than a flexible pavement. However, there was significant overlap in the data collected and the effect was not statistically significant. The study also looked at the effect of texture and it was suggested that it would be more cost-beneficial to change texture than to reconstruct pavements to increase stiffness.
Temperature
One of the main factors affecting rolling resistance is the ambient air temperature. It affects both the tyres and pavement. When measuring rolling resistance values are normally corrected to a reference temperature, such as 20oC for testing outdoors or 25oC under laboratory conditions7. It follows that to avoid large corrections, testing should be carried out as close to the reference temperature as possible.
As stated above, asphalt pavements deform more easily. This is particularly true at high ambient temperatures. However, owing to the viscoelastic nature of asphalt the deformation of the asphalt reduces with temperature.
Water
The presence of water or snow on the surface increases rolling resistance. It does this in two ways by cooling the tyre and the required effort to move or shed the water at the tyre-pavement interface. Highly textured surfacing makes the removal of water easier as it reduces the water depth; increased macrotexture has the effect of providing escape channels and spaces for water. The latter is particularly important at high speeds to prevent aquaplaning[1] where there is not enough time for water to escape from the tyre-road interface.
Road surfaces with low rolling resistance
Denmark
In 2011, the Danish government provided funding for the COOEE project: CO2 emission reduction by exploitation of rolling resistance modelling of pavements. The challenge was to develop a road pavement with low rolling resistance that still provided other functionalities, such as adequate friction and low noise.
During the project, three stone mastic asphalts (SMA) were laid on three different test sections and the properties of the SMAs were monitored annually. Two asphalt mixtures known as SMA8 COOEE and SMA6 COOEE were optimized with the purpose of reducing their texture depth. Rolling resistance data was collected using the TUG trailer. When compared to a standard 8mm SMA, the SMA6 and SMA8 COOEE mixtures reduced the rolling resistance by approximately 5% and 3%, respectively. However, an increase in texture (MPD) was measured in the third year and the material began to deteriorate through ravelling. The study recommended that the stability and durability of the texture and mixtures needed to be improved, and the influence of the longitudinal profile needed further investigation.
Building on the above research, the Danish Road Directorate (DRD) has continued to develop a surface course known as Climate Friendly Asphalt (KVS) which has been designed to be durable and have low rolling resistance and noise characteristics. The most recent project report (Climate friendly asphalt (2019), Vejdirektoratet, Carsten Niebuhrs Gade 43, 1577 Copenhagen.) describes four different trial sections which were paved in 2018 by four different contractors. The KVS specifications were based on the European product standard for SMA (EN13108-5:2016) plus additional features. The main difference is related to the mastic and thickness of the binder coating around the aggregates. This appears to have been achieved through the use of additional filler components, such as limestone filler, hydrated lime and cement. Paving operations were monitored and recorded using temperature control as this has been demonstrated to impact on the functional properties of the finished layer in terms of profile and durability.
In general, the project has shown that KVS asphalt has long lasting texture with reduced rolling resistance and fuel consumption properties. Noise reduction of the KVS surfacing does not differ significantly from a standard 8mm SMA but it is expected to last longer over time due to the enhanced durability and stability of the texture. The following results were reported:
- Rolling resistance reduction reduces with increases in speed and KVS is more effective at low speeds, i.e. 50 km/h.
- KVS has low rolling resistance compared to standard SMA8 and SMA11; on average, KVS has showed a 7% rolling resistance reduction over the term of the study.
- The expected CO2 reductions, averaged over a pavement life span of 17 years, are approximately 1.5% and 1.1%, respectively compared to standard SMA8 and SMA11.
- Durability of the KVS is comparable to standard SMA11, with an expected service life of 17 years.
- Noise reduction of the KVS is similar to standard SMA8 but it is expected to last longer due to long-lasting properties.
UK
Highways England commissioned a project to evaluate the performance of Low Rolling Resistance Asphalt Mixtures (LRRAM). The study comprised laying the LRRAM along with control materials in road trials in 2019 with a view to improving air quality standards. The LRRAM is described as a newly designed SMA, namely 10 mm SuperCurve, characterised by smaller aggregate size (10 mm) and optimised gradation. Compared to the control used in the trial, namely 14mm SuperHitex, the LRRAM had a higher binder content (6.4%), lower air voids content (4.2% in-situ) and lower texture (1.1mm – volumetric sand patch test).
The TUG trailer was used to evaluate the rolling resistance properties of the two materials. On one site the control had been in service for two years. Measurements of road roughness, macrotexture and skid resistance were collected. A summary of the main outcomes from the testing were:
- The LRRAM produced a lower Cr (up to 5.88%) than the newly laid control.
- Both the LRRAM and the control produced lower Cr than the 2-year-old control material, up to 11.86% and 15.59%, respectively.
- The LRRAM tested was generally characterised by having a lower macrotexture than the control, which could explain the lower Cr. However, the 2-year-old control presented a lower macrotexture than the LRRAM and newly laid control. This suggests that differences in road roughness, e.g. longitudinal profile variance (LPV) at 3m and 10m wavelength, may influence rolling resistance more than macrotexture.
- Results highlighted that low rolling resistance tyre technology might have a larger influence on fuel consumption and air quality improvements than LRRAM.
The report recommended additional monitoring to validate the early results and better understand degradation of rolling resistance properties in service.
Lower fuel consumption and carbon savings related to low rolling resistance
Increases in rolling resistance will result in increases in fuel consumption and this will increase exhaust emissions and subsequent air pollution affecting the environment.
According to Mickūnaitis the average fuel consumption and CO2 emission of automobiles using diesel are lower than motor cars with petrol engines. However, the latter has some advantages over diesel engines when the amount of CO2 emissions is concerned, i.e., diesel generates 2.7 kg of CO2 per litre and petrol generates 2.4 kg per litre.
A study that collected data from various trials that investigated the influence of rolling resistance on fuel consumption tentatively concluded that the average influence was 10% for macrotexture, 12% for megatexture, and 8% for unevenness. The studies included various measurement methods, i.e., fuel consumption, trailer, coast-down and drum. The values varied but indicate the influence on fuel consumption when comparing the smoothest road surfaces with the roughest. The study used a simple formula to express the relationship between fuel consumption and rolling resistance:
ΔFC = 0.25.ΔCr
Where ΔFC is the change in fuel consumption and ΔCr is the change in rolling resistance coefficient relative to the smoothest and most uneven road surface.
The above equation suggest that if the Cr is reduced by 10% then this would result in 2.5% saving in fuel consumption. This compares to calculations carried out by Bridgestone, that rolling resistance accounts for about one-quarter to one-third of a truck’s fuel consumption. So, if rolling resistance decreases by 10% the result is about a 3% decrease in fuel consumption, i.e. 1/4 x 10% = 2.5% to 1/3 x 10% = 3%.
According to US Department of Energy, only about 12%–30% of the energy from the fuel you put in a conventional vehicle is used to move it down the road, depending on the drive cycle. The rest of the energy is lost to engine and driveline inefficiencies or used to power accessories. Therefore, the potential to improve fuel efficiency with advanced technologies is enormous. Figure 2-8 shows the vehicle energy flows in an urban driving cycle for a typical gasoline-powered car. The figure is taken from a MIT report that concluded that a 30-50% reduction in fuel consumption was feasible over the next 30 years.
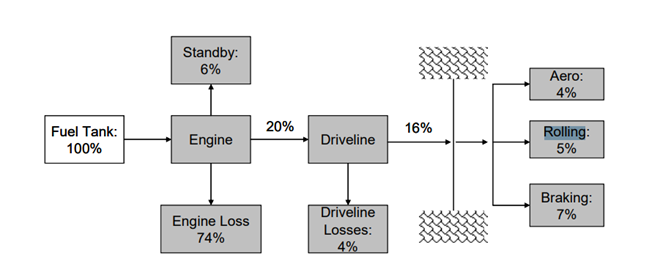
It is estimated that conventionally fuelled passenger vehicles use about 4%–7% of their fuel to overcome tyre rolling resistance. All-electric passenger vehicles are much more efficient than their gasoline-powered counterparts and only 15 to 20% is lost to the electric drive when compared to the 74% loss for the gasoline engine shown in the figure above. However, approximately 25% of their energy is used for overcoming rolling resistance, and for heavy trucks, this quantity can be as high as 30–33%. The reason for these increases is related to vehicle weight and size. The Department of Energy describes rolling resistance as a complex phenomenon and nearly all operating conditions can affect the final outcome. Installing low rolling resistance tyres are recommended and proper tyre inflation is also stressed.
A Danish study in 2010 conducted a socio-economic analysis of the benefits to be gained by using energy‑saving road pavement materials. The study estimated that potential savings in fuel consumption (and hence CO2 emissions) from optimising the pavement with respect to rolling resistance represented a value to society as large as the entire cost of maintaining the pavement. The study considered that the most important rolling resistance factors were the road’s texture (MPD) and roughness (IRI), and the socioeconomic analysis focussed on these values. It was also hypothesised that fuel consumption increases by 3% when rolling resistance increases by 10%. The report summary stated that replacing the road pavement on all State roads over a period of 15 years would lead to total socio-economic savings of DKK 1.9 billion, as follows:
- The annual fuel consumption will be reduced by 48 million litres, equivalent to a value of at least DKK 250 million.
- The emission of GHGs will be reduced by 45,000 tonnes of CO2 equivalent annually, which corresponds to DKK 30.5 million.
- NOx and SO2 emissions will be reduced. This corresponds to DKK 28 million.
A paper based on reviewing rolling resistance research and modelling, highlights that the basic challenge in roughness and texture modelling is to extract useful information from existing road data that is available. The paper suggests that owing to the availability of numerical computing resources, modelling of the tyre-pavement contact zone is advancing but still under development.
A study in the USA developed models for estimating the effects of pavement conditions on vehicle operating costs. The research focused on the cost components that are mostly affected by pavement conditions, namely, fuel consumption, repair and maintenance costs, and tyre wear. Large quantities of data were used to calibrate and validate the HDM 4 fuel consumption and tyre wear models for conditions in the United States. The study showed that vehicle operating costs increase with pavement roughness for all classes of vehicles. For fuel consumption, the most important factor was surface roughness as measured using IRI. An increase in IRI of 1 m/km increased the fuel consumption of passenger cars by about 2% irrespective of speed. For heavy trucks, this increase was about 1% at normal highway speed (60 mph) and about 2% at low speed (35 mph). Surface texture as measured by MPD and pavement type did not affect the fuel consumption of any vehicle class except for heavy trucks, where an increase in MPD of 1 mm increased fuel consumption by about 1.5% at 55 mph and about 2% at 56 km/h 35 mph.
A more recent study investigated whether current rolling resistance models can be used in carbon footprint/ life cycle assessment (LCA) studies. Two case studies were examined that used different models: the University of California Pavement Research Centre (UCPRC) model (using the HDM 4 model mentioned above) and the Swedish National Road and Transport Research Institute (VTI) model. The study concluded that the use of the UCPRC and VTI models in the UK should be treated with caution. The models produced different results and were both very sensitive to the level of pavement condition and its deterioration rate. It is stated that for UK roads there is insufficient information available to predict the deterioration of roughness and texture depth over time.
Safety
Skid resistance
Providing the most appropriate level of skid resistance is challenging for several reasons owing to changes and developments in road materials, driving behaviour, car technology and the nature of the road environment. However, new surfaces in the UK are generally produced with aggregates that are resistant to polishing and possess a minimum initial texture depth after laying to maintain high-speed skidding resistance. A reduction in texture depth over time is commonly observed, especially in the most heavily trafficked lanes. The UK standards covering skid resistance are briefly summarised below.
In the UK surface course materials for new and maintenance construction on both flexible and rigid pavements must comply with CD 236. Typically, the selection of coarse aggregate must demonstrate resistance to polishing and an appropriate aggregate PSV must be selected based on relevant site categories and traffic levels. The standard also makes reference to a minimum texture depth which is dependent on the mixture type and location. However, an alternative within the standard includes a material used in Scotland where the performance is based on an in-service low-speed skid resistance requirement.
Once a material is laid on the network it is important for safety reasons that it provides adequate skid resistance. The current UK standard used to determine appropriate levels of skid resistance on the strategic road network is known as CS 228. The standard provides the procedure for measuring skid resistance and provides a methodology to assess the requirement for maintenance work where the measured skid resistance falls below a predetermined level. In addition, CS 230 sets out requirements for reviewing network level data in order to establish whether there is a pavement maintenance need that requires further investigation. The standard specifies a range of sensor measured textured depth (SMTD) that can indicate a potential loss of skid resistance.
Skid resistance of low rolling resistance surfacing
The 2018 Danish climate friendly asphalt trials included the measurement of friction properties using the VIAFRIK machine which uses a fixed slip ratio of 20% between the measuring wheel and speed of travel. The friction coefficient is measured and reported as the mean friction coefficient for each 100m stretch. One trial on the M60 had a friction requirement (F ≥ 0.5) that was not met. Repeat measurements were made three months after the original but no change was reported and the study report states that the M60 will be water blasted to increase texture depth and elevate friction properties. The average MPD was less than 0.4mm and the lowest recorded during the trials. The report speculates that construction issues (high temperatures) combined with low air voids in the mixture (1.5%) led to ‘free binder’ flowing to the surface. The report concludes that the thicker coating of the mortar in the low rolling resistance mixtures makes them more slippery in the beginning compared to standard materials, i.e. the rate of which friction develops to a stable level is longer. It appears that the Danish materials are still being developed with a view to reducing risks of low friction.
UK trials of low rolling resistance9 found that they provided lower skid resistance than the control, but both low speed and high speed were within the typical range for newly laid surface courses. The report recommends that the low rolling resistance should be monitored to ensure they meet the national standards described above throughout their expected lifespan.
Particulate emissions
According to the US Environment Protection Agency, particulate matter (PM) is a term for a mixture of solid particles and liquid droplets found in the air. Particle pollution includes:
- PM10 : inhalable particles, with diameters that are generally 10 micrometers and smaller; and
- 5 : fine inhalable particles, with diameters that are generally 2.5 micrometers and smaller.
Examples of PM10 include dust, pollen and mold, which are < 10 μm, and some are large or dark enough to be seen with the naked eye. Finer particles, such as PM2.5, can only be detected using microscopes and include combustion particles and organic compounds. Some particles less than 10 micrometers can get deep into the lungs and some may even get into the blood stream, and the fine or PM2.5 particles pose the greatest risk to health.
An article published in the Guardian, claimed that car tyres produce vastly more particle pollution than exhausts. Tyre wear accounts for around 4kg per car per year and ultra fine particles can be found in human urine. Potential solutions include reducing wear rates and toxicity of components that go into the construction of tyres, although this may involve considering trade-offs with safety, noise and efficiency.
Research into the effect of tyre wear on noise emission and rolling resistance was carried out using the drum method on tyres as the tread was worn from a new condition (8mm) to a 2mm tread depth. The findings showed that rolling resistance reduced from a new unworn tyre to an old worn out tyre by 30%.
Research published in the journal Nature Communications concerns the atmospheric transport of microplastic particles produced by road traffic, namely tire wear particles (TWP) and break wear particles (BWP). The research suggests that the light-absorbing properties of TWPs and BWPs may contribute to the accelerated warming of the cryosphere.
Researchers from Imperial College warn that even though electric vehicles remove the problem of fuel emissions, we will continue to have a problem with particulate matter because of tyre wear. The Tyre Collective is a clean-tech company founded in 2020 that has developed technology that uses electrostatics and airflow to attract tyre wear particles ranging from 0.3 to 136 micrometres.
It is widely recognised that tyre wear is affected by surface microtexture13. Laboratory drum tests showed an average of 5% more rolling resistance on a sandpaper-like surface compared to a smooth steel surface. However, it should be noted that microtexture is a dominant factor influencing skid resistance at low speed, and research shows that it also has an important influence at high speeds.